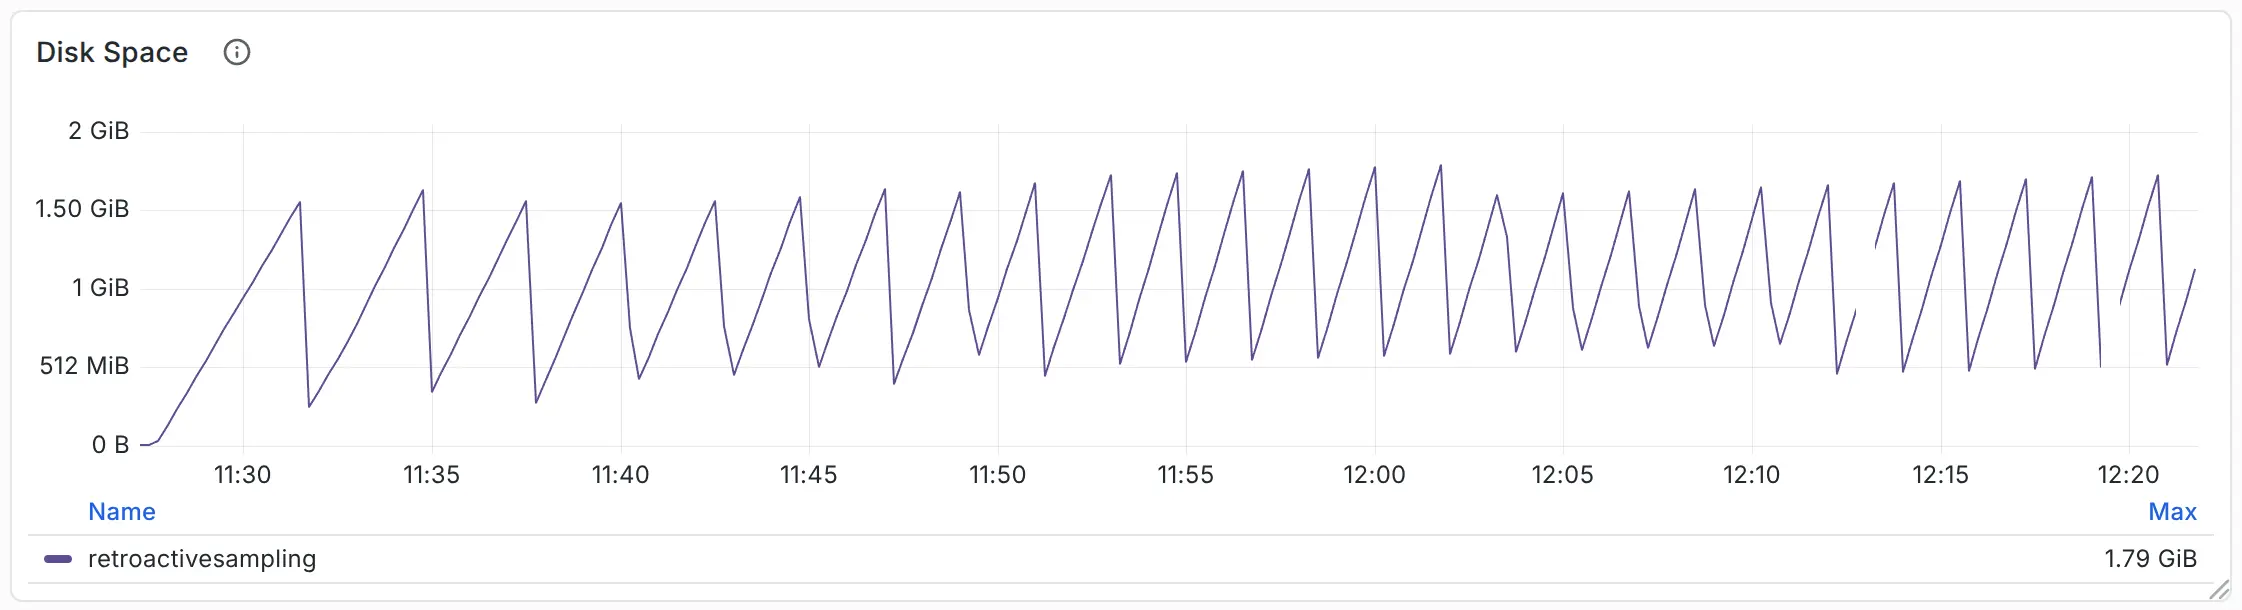
Hacker News Top 30 — 2026-04-22

Generated 2026-04-22 03:13 UTC · ← all digests

1.ChatGPT Images 2.0

Sourcehttps://openai.com/index/introducing-chatgpt-images-2-0/

SiteOpenAI

Submitterwahnfrieden (Hacker News)

Submitted2026-04-21 18:50 UTC (Hacker News)

HN activity517 points · 458 comments

Length17 words (~1 min read)

Languageen-US

ChatGPT Images 2.0 introduces a state-of-the-art image generation model with improved text rendering, multilingual support, and advanced visual reasoning.

April 21, 2026

ProductReleaseCompany

A new era of image generation

Try in ChatGPT(opens in a new window)

↑ top

2.Windows Server 2025 Runs Better on ARM

Sourcehttps://jasoneckert.github.io/myblog/server-2025-arm64/

Sitejasoneckert.github.io

AuthorJason Eckert

Submitted2026-04-19 04:28 UTC (Hacker News)

HN activity70 points · 48 comments

Length1.1K words (~5 min read)

Languageen-us

My personal website and blog

Windows Server 2025 Admin Center

I’m currently working on the next edition of my Windows Server book for Cengage, updating everything from Windows Server 2022 to 2025. As you’d expect, my primary lab machine is a high-end 14th Gen Intel Core i9 system running Windows 11, hosting multiple Hyper-V virtual machines (VMs) for roles like Active Directory, IIS, DNS, DHCP, and more.

Out of curiosity (and honestly, just for fun), I decided to spin up the same Windows Server 2025 environment in Hyper-V on my Snapdragon X Elite system running Windows 11 on ARM. Microsoft does not provide an official installation ISO image of Windows Server 2025 for ARM on their website, so I used UUP dump to generate one from Microsoft’s update servers and installed the same set of VMs with it.

It was stable, functional, and fully usable as you’d expect… but there was one big difference: Everything felt much, much faster! Services started more quickly (including Active Directory, which is usually a bit of a slog), management consoles opened faster, and the same hands-on tasks I was writing for my textbook consistently completed in less time.

The Hyper-V VMs are configured identically in terms of memory, virtual processors, and installed roles for their native CPU architectures:

  • Snapdragon X Elite = ARM64 guest on ARM64 host
  • Intel Core i9 = x64 guest on x64 host

At this point, it may look like the architecture is the only real difference, and the major contributor to the performance, but that’s a bit misleading. The systems differ in more than just CPU architecture. Storage, memory, power management, and thermal behavior can all influence results. So rather than claiming “ARM is faster,” it’s better to look at how performance differs holistically.

Any good IT admin will tell you that workload type matters when it comes to performance. Both VMs are running the typical services you’d expect on a Windows Server: Active Directory, DNS, DHCP, IIS, File services (SMB/NFS/DFS), Print Services, Certificate Services, Remote Desktop Services, Routing and Remote Access, NPS, and so on. These services are typically thread-heavy and often have frequent-but-small CPU and I/O (read/write) operations, which means they are sensitive to latency and context switching (where a computer’s CPU stops one task to start another). In other words, they don’t tolerate variability well, and benefit from a system that provides consistent performance all the time.

This partially explains why the Snapdragon seems faster. Like many ARM systems, it doesn’t chase high boost clocks and instead delivers steady, sustained performance (including I/O). In contrast, modern Intel CPUs tend to ramp frequency quickly and throttle dynamically under load. That approach can deliver excellent peak performance, but it also introduces more variability in scheduling and latency under sustained or mixed workloads.

That variability matters even more in a virtualized environment. Hypervisors like Hyper-V are basically hardware schedulers. If the underlying hardware delivers more predictable execution timing, the hypervisor can make more consistent scheduling decisions. That, in turn, benefits the VMs and the services running inside them.

There may also be differences in the Windows Server ARM64 build itself. Various release notes I found online suggest that the ARM64 version of Windows Server avoids some legacy compatibility layers and uses more modern, optimized binaries. In other words, it’s likely a cleaner build than the x64 version. And anyone who has been tasked with refactoring code can tell you that those small efficiencies add up.

Digging deeper with Performance Monitor

To test this, I ran a series of measurements. First, I added the following counters to Performance Monitor on both Windows 11 hosts:

  • \Processor(_Total)\% Processor Time (overall CPU utilization across all cores)
  • \System\Processor Queue Length (# of threads waiting in the processor queue for CPU time - should be zero if everything is optimal)
  • \Hyper-V Hypervisor Virtual Processor(*)\CPU Wait Time Per Dispatch (average time virtual processors wait to be scheduled on the CPU)

Then, I ran the following within PowerShell on each VM to generate some load, and watched the results in Performance Monitor:

1..8 | ForEach-Object {
    while ($true) { Get-Process | Sort-Object CPU -Descending | Select-Object -First 5 | Out-Null }
}

The Snapdragon had that steady, sustained performance I expected while the Intel had the typical boost/throttle variation. % Processor Time fluctuated far less on the Snapdragon system. Processor Queue Length stayed at zero on Snapdragon, but periodically spiked on Intel. CPU Wait Time Per Dispatch was flat and consistent on Snapdragon, but varied significantly on Intel.

Measuring service responsiveness

In PowerShell on each VM, I also used Measure-Command to test how long common operations took for several of the services running. For example, I ran the following to see how long it took to hit the IIS web server 1000 times:

Measure-Command { 1..1000 | foreach { Invoke-WebRequest http://localhost -UseBasicParsing | Out-Null } }

I repeated this process but replaced the Invoke-WebRequest command to test:

  • DNS (Resolve-DnsName "domainX.com" -Server 127.0.0.1 | Out-Null)
  • Active Directory lookups (Get-ADUser -Filter * -ResultSetSize 1 | Out-Null)
  • Domain authentication latency (Test-ComputerSecureChannel -Verbose:$false)
  • And even some file I/O:
$path = "C:\TestFiles"
mkdir $path -ea 0

Measure-Command {
    1..2000 | foreach {
        $file = "$path\file$_.txt"
        Set-Content $file "test"
        Get-Content $file | Out-Null
        Remove-Item $file
    }
}

Across multiple runs of each test, the Snapdragon system produced consistent, repeatable timings nearly every time. On the Intel system, results varied significantly, occasionally beating the Snapdragon, but most of the time falling behind. The Snapdragon was the clear winner on each test overall.

Summary

The common thread across these results is latency consistency. These Windows Server workloads need predictable scheduling and fast response to small, frequent operations… especially under virtualization. If your workloads depend on peak throughput, x64 systems still have clear advantages. But if your environment looks like a typical Windows Server deployment with many small, latency-sensitive operations running under virtualization, then consistency may matter more than raw speed.

And in that context, ARM64 looks very attractive. Plus, it’s already widely used in cloud environments where the performance-to-cost ratio is much better than x64… which begs the question: If Windows Server workloads benefit from this kind of performance, shouldn’t Microsoft be making ARM64 play a larger role in its future? Right now, Microsoft doesn’t fully support Windows Server on ARM64, yet 33% of all new Microsoft Azure VM instances last year were ARM64 (50% for Amazon’s AWS).

Hopefully Microsoft will spend more time in the future on their server product strategy and less on Copilot ;-)

Note: For my Cengage textbook, I’m still standardizing on x64. The reason is simple: nested virtualization is part of the lab setup, and that’s not yet supported on ARM64 in Hyper-V. Students could adapt the labs to work around this, but one of the goals of the book is reproducibility… having everything “just work” step by step. For now, x64 remains the practical choice for teaching.

↑ top

3.SpaceX says it has agreement to acquire Cursor for $60B

Sourcehttps://twitter.com/spacex/status/2046713419978453374

Redirected tohttps://x.com/spacex/status/2046713419978453374

SiteX (formerly Twitter)

Submitterdmarcos (Hacker News)

Submitted2026-04-21 22:13 UTC (Hacker News)

HN activity330 points · 458 comments

Length27 words (~1 min read)

Languageen

Something went wrong, but don’t fret — let’s give it another shot.

Something went wrong, but don’t fret — let’s give it another shot.

⚠️ Some privacy related extensions may cause issues on x.com. Please disable them and try again.

↑ top

4.The Vercel breach: OAuth attack exposes risk in platform environment variables

Sourcehttps://www.trendmicro.com/en_us/research/26/d/vercel-breach-oauth-supply-chain.html

SiteTrend Micro

AuthorBy: Peter Girnus Apr 20, 2026 Read time:  ( words)

Published2026-04-20

HN activity275 points · 104 comments

Length6.7K words (~30 min read)

Languageen-US

An OAuth supply chain compromise at Vercel exposed how trusted third party apps and platform environment variables can bypass traditional defenses and amplify blast radius. This article examines the attack chain, underlying design tradeoffs, and what it reveals about modern PaaS and software supply chain risk.

Key takeaways

  • A compromised third‑party OAuth application enabled long‑lived, password‑independent access to Vercel’s internal systems, demonstrating how OAuth trust relationships can bypass traditional perimeter defenses.
  • The impact was amplified by Vercel’s environment variable model, where credentials not explicitly marked as sensitive were readable with internal access - meaning that for any team whose access was compromised, non-sensitive environment variables were exposed without additional controls.
  • A publicly reported leaked‑credential alert predating disclosure highlights detection‑to‑notification latency as a critical risk factor in platform breaches.
  • This incident fits a broader 2026 convergence pattern (LiteLLM, Axios) in which attackers consistently target developer‑stored credentials across CI/CD, package registries, OAuth integrations, and deployment platforms.
  • Effective defense requires architectural change: treating OAuth apps as third‑party vendors, eliminating long‑lived platform secrets, and designing for the assumption of provider‑side compromise.

Developing situation — last updated Tuesday, April 21, 2026

This entry was updated on April 21 to correct the incident timeline and scope characterization based on post-publication reporting from Context.ai's security bulletin.

Key corrections: the initial compromise occurred in February 2026 (not June 2024), the initial access vector was Lumma Stealer malware (not an unknown mechanism), the dwell time was approximately two months (not 22 months), and the impact was scoped to teams whose access was directly compromised — not a blanket platform-wide exposure of customer secrets. Environment variables not explicitly marked as "sensitive" were readable within compromised team scopes, but this required per-team access, not a single point of platform-wide credential exposure. The original language overstated the blast radius; we regret the error.

This analysis reflects what is publicly known about the Vercel OAuth supply chain compromise as of the date above. The incident remains under active investigation by Vercel and affected parties, and key details — including the full scope of downstream impact and attribution — may evolve as additional information becomes available. Where gaps exist, we have noted them explicitly rather than speculating. Defensive recommendations and detection guidance are based on the confirmed attack chain and established supply chain compromise patterns; organizations should act on these now rather than waiting for a complete picture. We will update this analysis as new technical details, vendor disclosures, or third-party research emerge.

In an intrusion that began with a Lumma Stealer malware infection at Context.ai in approximately February 2026 and was disclosed in April 2026, attackers leveraged a compromise of Context.ai’s Google Workspace OAuth tokens to gain a foothold into Vercel’s internal systems, exposing environment variables for an undisclosed but reportedly limited subset of customer projects. Vercel is a cloud deployment and hosting platform widely used for front‑end and serverless applications.

On April 19, 2026, Vercel published its security bulletin and CEO Guillermo Rauch posted a detailed thread on X confirming the attack chain and naming Context.ai as the compromised third party.

The incident is significant because it demonstrates how OAuth supply-chain trust relationships create lateral movement paths that bypass traditional perimeter defenses, and because Vercel's environment variable sensitivity model left non-sensitive credentials not encrypted at rest, making it readable to an attacker with internal access.

This analysis examines the attack chain, evaluates the platform design decisions that amplified blast radius, contextualizes the breach against a rising wave of supply chain compromises (LiteLLM, Axios, Codecov, CircleCI), and provides actionable detection and hardening guidance for organizations operating on Vercel and similar PaaS platforms.

What this incident reveals

What makes this incident notable is not its sophistication, the techniques used are well-established, but for three broader implications that make it especially significant:

  • OAuth amplification. A single OAuth trust relationship cascaded from a compromised vendor into Vercel’s internal systems, exposing environment variables for a limited subset of customer projects — customers who had no direct relationship with the compromised vendor.
  • AI-accelerated tradecraft. The CEO publicly attributed the attacker's unusual velocity to AI augmentation — an early, high-profile data point in the 2026 discourse around AI-accelerated adversary tradecraft.
  • Detection-to-disclosure latency. At least one public customer report suggests credentials were being flagged as leaked in the wild nine days before Vercel's disclosure — raising questions about detection-to-disclosure latency in platform breaches.

Incident timeline

Based on currently available reporting, the attack spanned approximately two months from the initial Lumma Stealer infection at Context.ai to Vercel’s public disclosure. While the dwell time is shorter than initially assessed, the attack demonstrates how OAuth-based intrusions leverage legitimate application permissions that rarely trigger standard detection controls.

Data Event Verification status

~February 2026

Context.ai employee infected with Lumma Stealer malware; corporate credentials, session tokens, and OAuth tokens exfiltrated

CONFIRMED — Hudson Rock, CyberScoop, Context.ai bulletin

~March 2026

Attacker accesses Context.ai’s AWS environment; exfiltrates OAuth tokens for consumer users including a Vercel employee’s Google Workspace token

CONFIRMED — Context.ai bulletin

March 2026

Attacker uses exfiltrated OAuth token to access Vercel employee’s Google Workspace account

CONFIRMED — Vercel bulletin, Context.ai bulletin, Rauch statement

March-April 2026

Attacker pivots into Vercel internal systems; customer environment variable enumeration begins

CONFIRMED — Vercel bulletin

~April 2026

ShinyHunters-affiliated actor allegedly begins selling Vercel data on BreachForums

UNVERIFIED — threat actor claims only

April 10, 2026

OpenAI notifies a Vercel customer of a leaked API key (per customer account on X)

REPORTED — single source

April 19, 2026

Vercel publishes security bulletin; Rauch posts detailed thread on X naming Context.ai

CONFIRMED

April 19, 2026 onward

Customer notification, credential rotation guidance, and dashboard changes rolled out

CONFIRMED

Table 1. Summary of key events and their confirmation status

A key observation from the timeline is that even with a relatively short dwell time of approximately two months, the attacker was able to progress from a Lumma Stealer infection at a third-party vendor to customer environment variable exfiltration at Vercel. This speed of lateral movement underscores the difficulty of detecting OAuth-based pivots that use legitimate application permissions.

It is worth noting that Google Workspace OAuth audit logs are retained six months by default on many subscription tiers. In this case, the approximately two-month dwell time means logs should still be within the retention window, but a longer-running compromise of this type could easily outlast default retention — a factor investigators should consider when setting retention policies.

Attack chain

The attack exploited a trust chain that is endemic to modern SaaS environments: third-party OAuth applications granted access to corporate Google Workspace accounts.

Figure 2. Vercel breach attack chain

Figure 2. Vercel breach attack chain

Stage 1: Third-Party OAuth compromise (T1199)

Context.ai, a company providing AI analytics tooling, had a Google Workspace OAuth application authorized by Vercel employees. The attacker compromised this OAuth application — the compromise has since been traced to a Lumma Stealer malware infection of a Context.ai employee in approximately February 2026, reportedly after the employee downloaded Roblox game exploit scripts (per Hudson Rock and CyberScoop). The stolen credentials enabled the attacker to access Context.ai’s AWS environment and exfiltrate OAuth tokens for consumer users of Context AI Office Suite, a self-serve consumer product launched in June 2025.

In his post on X, Rauch stated that Vercel has “reached out to Context to assist in understanding the full scale of the incident,” phrasing that suggests Context may not have detected the compromise itself. Context.ai has since published its own security bulletin confirming it detected and stopped the unauthorized access to its AWS environment in March 2026, though the OAuth token exfiltration was not identified until Vercel’s investigation.

This is the critical initial access vector. OAuth applications, once authorized, maintain persistent access tokens that:

  • Do not require the user's password
  • Survive password rotations
  • Often have broad scopes (email, drive, calendar access)
  • Are rarely audited after initial authorization

Stage 2: Workspace account takeover (T1550.001)

Using the compromised OAuth application's access, the attacker pivoted to a Vercel employee's Google Workspace account. This provided email access (potential for further credential harvesting), internal document access via Google Drive, calendar visibility into meetings and linked resources, and potential access to other OAuth-connected services.

Stage 3: Internal system access (T1078)

From the compromised Workspace account, the attacker pivoted into Vercel's internal systems. Rauch described the escalation as “a series of maneuvers that escalated from our colleague's compromised Vercel Google Workspace account.” The specific lateral movement technique — whether via SSO federation, harvested credentials from email/drive, or another OAuth-connected internal tool — has not been disclosed.

Stage 4: Environment variable enumeration (T1552.001)

The attacker accessed Vercel's internal systems with sufficient privileges to enumerate customer project environment variables. As per Rauch's public statement: Vercel stores all customer environment variables fully encrypted at rest, but the platform offers a capability to designate variables as “non-sensitive.” Through enumeration of these non-sensitive variables, the attacker obtained further access.

Stage 5: Potential downstream exploitation (T1078.004)

Exposed environment variables commonly contain credentials for downstream services. A single public customer report by Andrey Zagoruiko (April 19, 2026) described receiving an OpenAI leaked-key notification on April 10 for an API key that, according to the report, only existed only in Vercel—suggesting that at least one exposed credential was detected in the wild prior to Vercel’s disclosure. 

This report introduces a potential detection-to-disclosure anomaly, which warrants closer examination and is explored in the following section.

Disclosure timeline anomaly

A public reply to Guillermo Rauch's April 19 thread on X surfaced a timeline detail that deserves independent attention. A Vercel customer, Andrey Zagoruiko, reported receiving a leaked-key notification from OpenAI on April 10, 2026—for an API key that, according to the customer, had never existed outside Vercel.

OpenAI's leaked-credential detection system typically triggers when an API key is found in a public location where it should not appear in (e.g., GitHub, paste sites, and similar sources). The pathway from a Vercel environment variable to an OpenAI notification is not trivially explained. Notably, the date creates a nine-day window between the earliest public evidence of exposure and Vercel's disclosure.

Figure 3. Disclosure timeline anomaly showing a nine‑day gap between apparent credential exposure and public notification.

Figure 3. Disclosure timeline anomaly showing a nine‑day gap between apparent credential exposure and public notification.

What the 9-day gap means and what it does not

It is important to note that this is a single public report, not a forensic finding. It should not be interpreted as proof that Vercel knew about the compromise on April 10.

It is, however, evidence that at least one credential was detected in the wild before customers were formally notified to rotate secrets. This distinction matters for three audiences:

  • Regulators: Under GDPR, the 72-hour breach notification clock starts when a controller becomes aware of a breach. The question of when Vercel became aware is now public.
  • Auditors: SOC 2 and ISO 27001 assessors will examine the detection-to-notification latency as part of continuous-monitoring evidence.
  • Customers: Organizations whose credentials may have been exposed cannot assume the exposure window ended on April 19. It may have begun being actively exploited well before.

From an incident-response planning perspective, this data point also validates a practical point: unsolicited leaked-credential notifications from providers, such as OpenAI, Anthropic, GitHub, AWS, Stripe, and the likes, are now a primary early-warning channel for platform breaches. Security teams should treat them as high-priority signals, not routine noise.

AI-accelerated tradecraft (CEO Assessment)

In his April 19 thread on X, Vercel CEO Guillermo Rauch explicitly stated: 

“We believe the attacking group to be highly sophisticated and, I strongly suspect, significantly accelerated by AI. They moved with surprising velocity and in-depth understanding of Vercel.”

This is a noteworthy on-record claim from a CEO of an affected platform and should be evaluated carefully. Attribution based on "velocity" is inherently interpretive, but it warrants attention for several reasons which we discuss in this section.

What "AI-accelerated" could plausibly look like in evidence

If Rauch’s assessment reflects something real rather than post-hoc rationalization, the underlying forensic signals would likely include one or more of the following:

  • Enumeration speed that exceeds manual pace. Scripting alone accounts for some of this, but LLM-driven reconnaissance can parallelize schema discovery, endpoint probing, and credential format recognition faster than manual query construction.
  • Contextual query construction. Queries that appear aware of Vercel-specific terminology (project slugs, deployment target names, env var naming conventions) without obvious prior reconnaissance.
  • Adaptive behavior in response to errors. LLM-assisted attackers tend to recover from API errors and rate-limits more fluently than static scripts, shifting strategy on the fly.
  • Prompt-engineered social artifacts. Phishing lures, commit messages, or support tickets that read as locally authentic rather than translated or templated.

Why this matters beyond the Vercel incident

Regardless of whether Rauch's assessment holds up to formal forensic review, the category itself—AI-augmented adversary operations—is no longer simply speculative. Microsoft's April 2026 publication on AI-enabled device-code phishing (Storm-2372 successor campaigns) documented live threat actors using generative AI for dynamic code generation, hyper-personalized lures, and backend automation orchestration. The implication is that telemetry baselines calibrated against human-paced attacker behavior may generate false negatives against AI-accelerated operators.

Detection-engineering implication

If AI-accelerated attackers compress the timeline of enumeration and lateral movement, detection rules tuned on dwell-time and velocity thresholds from older incident data may under-alert. In particular, teams should consider revisiting thresholds on: unique-resource enumeration rate per session, error-to-success ratio recovery curves, and diversity of query patterns within a short window.

The environment variable design problem

The most consequential aspect of this breach is not the initial access vector — OAuth compromises are a known and studied risk. It is Vercel's environment variable sensitivity model, which created a default-insecure configuration for customer secrets.

Figure 4. The environment variable design problem, comparing default‑insecure secrets‑manager models with secure‑by‑default approaches.

Figure 4. The environment variable design problem, comparing default‑insecure secrets‑manager models with secure‑by‑default approaches.

How Vercel environment variables worked at the time of the breach

Vercel projects use environment variables to inject configuration and secrets into serverless functions and build processes. These variables have a "sensitive" flag that controls access restrictions, as seen in Table 2.

Property Default (Non-sensitive) Sensitive

Default state

ON (all new vars)

Must be explicitly enabled

Visible in dashboard

Yes

Masked after creation

Accessible via internal APIs

Yes

Restricted

Encrypted at rest

No (according to Rauch)

Yes, with additional restrictions

Accessible to attacker in this breach

Yes

Appears not

Table 2. Comparison of Vercel environment variable handling based on sensitivity flag.

The critical design choice

The sensitive flag is off by default. Every DATABASE_URL, API_KEY, STRIPE_SECRET_KEY, or AWS_SECRET_ACCESS_KEY added by a developer who did not explicitly toggle this flag was stored unencrypted at rest in Vercel's internal access model.

Any security control that requires explicit opt-in for every individual secret, with no guardrails or defaults, will have a low adoption rate in practice.

Vercel's response

Rauch confirmed that Vercel has already rolled out dashboard changes: an overview page for environment variables and an improved UI for sensitive variable creation and management. These changes improve discoverability, but as of this writing do not change the default — developers must still opt in per variable. Whether Vercel will flip the default remains an open question that customers should press on.

Comparison to industry peers

The industry trend is toward purpose-built secret storage, such as Vault, AWS Secrets Manager, Doppler, and Infisical, rather than environment variable stores with sensitivity tiers. This breach validates that architectural choice.

Table 3 summarizes how Vercel’s environment variable based approach compares to common practices among similar platforms.

Platform Default secret handling Auto-detection

Vercel

Non-sensitive by default; manual flag

No

AWS SSM Parameter Store

Supports SecureString type

No (but distinct API)

HashiCorp Vault

All secrets encrypted with ACL

N/A (purpose-built)

GitHub Actions

All secrets masked in logs

No (but separate secrets UI)

Netlify

Environment variables with secret toggle

No

Table 3. Comparison of Vercel’s environment variable–based secret handling with industry peer platforms that employ dedicated secret management systems.

Credential fan-Out: Quantifying downstream risk

The term “credential fan-out” describes how a single platform breach cascades into exposure across every downstream service authenticated by credentials stored on that platform.

Figure 5. Illustration of credential fan-out and how one platform breach can turn into many

Figure 5. Illustration of credential fan-out and how one platform breach can turn into many

For this particular case, we summarize in Table 4 what Vercel project environment variables may typically include and their downstream impact.

Category Example variables Downstream impact

Database

DATABASE_URL, POSTGRES_PASSWORD

Full data access

Cloud

AWS_ACCESS_KEY_ID, AWS_SECRET_ACCESS_KEY

Cloud account compromise

Payment

STRIPE_SECRET_KEY, STRIPE_WEBHOOK_SECRET

Financial data, refund fraud

Auth

AUTH0_SECRET, NEXTAUTH_SECRET

Session forgery, account takeover

Email

SENDGRID_API_KEY, POSTMARK_TOKEN

Phishing from trusted domains

Monitoring

DATADOG_API_KEY, SENTRY_DSN

Telemetry manipulation

Source

GITHUB_TOKEN, NPM_TOKEN

Supply chain injection

AI/ML

OPENAI_API_KEY, ANTHROPIC_API_KEY

API abuse, cost generation

Table 4. Environment variables commonly stored in Vercel projects and the potential downstream impact if exposed.

A single Vercel project commonly contains 10 to 30 environment variables. At an organization scale, a portfolio of 50 projects could have 500 to 1,500 credentials within the platform. In this incident, the attacker accessed a limited subset of customer projects, but each exposed credential is a potential pivot point into an entirely separate system with its own blast radius.

This is the multiplier that elevates a platform breach from a confidentiality event into a potential cascade across the software supply chain.

Why OAuth trust relationships bypass perimeter defenses

A fundamental reason this attack succeeded for approximately 22 months is that OAuth-based intrusion bypasses most of the controls that would catch a traditional credential-based attack.

Every defensive control in the left column is something security teams rely on to detect or block account compromise. Every one of those controls is either irrelevant or already satisfied in the OAuth-app compromise path. This asymmetry is the reason OAuth governance is emerging as a distinct security discipline, separate from identity and access management.

Figure 6. Comparison of traditional credential based attack paths and OAuth application compromise, illustrating how OAuth trust relationships bypass perimeter security controls and enable silent lateral movement.

Figure 6. Comparison of traditional credential based attack paths and OAuth application compromise, illustrating how OAuth trust relationships bypass perimeter security controls and enable silent lateral movement.

OAuth governance as a vendor-risk function

Most organizations treat OAuth grants as a developer self-service problem: each employee authorizes the tools they need, with minimal central review. This incident argues OAuth grants should be treated as third-party risk management — every authorized OAuth app is effectively a vendor with persistent access to corporate data, and should be vendor-reviewed, periodically re-authorized, and monitored for anomalous use.

Threat actor claims and attribution

Threat actor claims on underground forums are inherently unreliable. The following is documented for awareness and threat tracking, not as confirmed fact. Attribution in breach scenarios is notoriously difficult, and forum claims are frequently exaggerated, fabricated, or made by parties tangentially related to an incident.

ShinyHunters-affiliated claims

A threat actor claiming affiliation with the ShinyHunters group posted on BreachForums alleging possession of Vercel data. 

Claimed data Quantity

Employee records

~580

Source code repositories

Not specified

API keys and internal tokens

Not specified

GitHub and NPM tokens

Not specified

Internal communications

Not specified

Linear workspace access

Not specified

Table 5. Summary of claimed data and their quantity, all of which remain unverified.

Several factors complicate attribution of the incident to the actor claiming ShinyHunters affiliation:

  • Known ShinyHunters members have publicly denied involvement to BleepingComputer.
  • A $2M ransom demand was allegedly communicated via Telegram — a common monetization pattern for both legitimate and fabricated breach claims.
  • The ShinyHunters brand has been used by multiple, potentially unrelated actors since the group's original campaigns.
  • Vercel's security bulletin does not reference these claims; Rauch's thread addresses the attack chain but not the forum posting directly.

Supply chain release path: Vercel's position

Rauch directly addressed the highest-impact scenario stating that “We've analyzed our supply chain, ensuring Next.js, Turbopack, and our many open source projects remain safe for our community.” 

Independent verification of release-path integrity is ongoing at the time of writing. Organizations using Next.js, Turbopack, or other Vercel open source projects should continue to monitor package integrity signals (checksums, signing, provenance attestations) as standard practice.

Without independent verification of the forum-claimed data, those claims should be treated as unconfirmed. The OAuth-based attack chain described by Vercel is technically sound and does not require the scope of access claimed by the forum poster, suggesting the claims may be exaggerated, may represent a separate unrelated incident, or may be fabricated.

MITRE ATT&CK Mapping

The confirmed attack chain maps cleanly to established MITRE ATT&CK techniques, as summarized in Table 6. The mapping reflects behaviors explicitly described in Vercel’s disclosure and aligns with well‑understood OAuth abuse patterns rather than novel exploitation.

Tactic Technique ID Application

Initial Access

Trusted Relationship

T1199

Context.ai OAuth app as trusted third party

Persistence

Application Access Token

T1550.001

OAuth token survives password rotation

Credential Access

Valid Accounts

T1078

Compromised employee Workspace credentials

Discovery

Account Discovery

T1087

Internal system and project enumeration

Credential Access

Unsecured Credentials: Credentials in Files

T1552.001

Non-sensitive env vars accessible

Lateral Movement

Valid Accounts: Cloud Accounts

T1078.004

Potential use of exposed cloud credentials

Collection

Data from Information Repositories

T1213

Env var enumeration across projects

Table 6. MITRE ATT&CK technique mapping for the Vercel incident.

Based on this mapping, the pivot from OAuth application access to internal system access (T1199 to T1078) is the highest-value detection point.

Organizations should therefore monitor for anomalous OAuth application behavior, particularly applications accessing resources outside their expected scope or from unexpected IP ranges.

The supply chain siege: LiteLLM, Axios and a converged pattern 

The Vercel breach did not occur in isolation. The period from March to April 2026 has seen an unprecedented concentration of software supply chain attacks, suggesting either coordinated campaign activity or—more likely—convergent discovery by multiple threat actors of the same structural weakness: the trust boundaries between package registries, CI/CD systems, OAuth providers, and deployment platforms.

Figure 7. Convergence of three distinct supply‑chain attack vectors on a single target: developer‑stored credentials and secrets.

Figure 7. Convergence of three distinct supply‑chain attack vectors on a single target: developer‑stored credentials and secrets.

March 24, 2026: LiteLLM PyPI supply chain compromise

Malicious PyPI packages litellm versions 1.82.7 and 1.82.8 were published using stolen CI/CD publishing credentials from Trivy (Aqua Security's vulnerability scanner). The attack targeted LiteLLM, a widely-used LLM proxy with ~3.4 million daily downloads. 

  • Initial access: Attacker (tracked as "TeamPCP") compromised Trivy's CI/CD pipeline credentials, which had PyPI publishing permissions.
  • Payload: Three-stage backdoor targeting 50+ credential types across major cloud providers, with Kubernetes DaemonSet persistence for lateral movement.
  • Dwell time: Malicious packages were live for approximately 40 minutes to 3 hours before detection and removal.
  • CVE involved: CVE-2026-33634.

March 31, 2026: Axios npm supply chain compromise 

The npm package axios (70–100 million weekly downloads) was compromised via maintainer account hijacking. Malicious versions 1.14.1 and 0.30.4 injected a dependency on plain-crypto-js@4.2.1, which contained a cross-platform Remote Access Trojan (RAT).

  • Initial access: Maintainer account hijacked (mechanism not disclosed; credential stuffing or phishing suspected).
  • Scale: 135 endpoints detected contacting attacker command-and-control infrastructure.
  • Dwell time: 2–3 hours before detection.
  • Attribution: Microsoft attributed the attack to Sapphire Sleet, a North Korean state-sponsored threat actor.

The convergence pattern

Three attacks in three weeks. Three different vectors. The same target: the credentials and secrets that developers store in their toolchains.

Incident Date Vector Target asset Dwell time

LiteLLM

Mar 24, 2026

CI/CD credential theft → PyPI

Developer credentials, API keys

40 min – 3 hrs

Axios

Mar 31, 2026

Maintainer account hijack → npm

Developer workstations (RAT)

2–3 hrs

Vercel

Apr 19, 2026

OAuth app compromise → platform

Customer env vars (credentials)

~22 months

Table 7. Summary of recent supply chain adjacent incidents targeting developer credentials and secret storage layers.

What previous platform breaches reveal

The Vercel breach follows a well-documented pattern of platform-level compromises that expose customer secrets at scale.

Codecov bash uploader breach (January – April 2021)

What happened: Attackers modified Codecov's Bash Uploader script (used in CI/CD pipelines) to exfiltrate environment variables from customers' CI environments. The compromise went undetected for approximately two months. 29,000+ customers potentially affected, including Twitch, HashiCorp, and Confluent.

Parallel to Vercel: Both incidents expose customer credentials stored as environment variables through a platform compromise.

CircleCI security incident (January 2023)

What happened: An attacker stole an employee's SSO session token via malware on a personal device, used it to access internal CircleCI systems, and exfiltrated customer secrets and encryption keys. CircleCI recommended all customers rotate every secret stored on the platform.

Parallel to Vercel: Nearly identical pattern — employee account compromise → internal system access → customer secret exfiltration.

Snowflake customer credential attacks (May–June 2024)

Threat actor UNC5537 used credentials obtained from infostealer malware to access Snowflake customer accounts that lacked MFA. Over 165 organizations affected, including Ticketmaster, Santander Bank, and AT&T.

Okta support system breach (October 2023)

Attackers accessed Okta's customer support case management system using stolen credentials, viewing HAR files that contained session tokens for Okta customers including Cloudflare, 1Password, and BeyondTrust.

Pattern summary

The pattern is clear. Platform-level access to customer secrets is a systemic risk that has been exploited repeatedly across CI/CD, identity, data warehouse, and deployment platforms. Each incident follows the same arc: initial access through a trust relationship or credential, lateral movement to internal systems, and exfiltration of customer secrets at varying scale — from targeted subsets to platform-wide exposure.

Incident Year Initial vector Customer asset exposed Detection lag

Codecov

2021

Supply chain (script modification)

CI env vars

~2 months

Okta

2023

Stolen support credentials

Session tokens (HAR files)

Weeks

CircleCI

2023

SSO session token theft

Secrets + encryption keys

Weeks

Snowflake

2024

Infostealer credentials (no MFA)

Customer data

Months

Vercel

2026

OAuth app compromise (via infostealer at vendor)

Deployment env vars

~2 months

Table 8. Pattern of recent platform level breaches illustrating repeated exposure of customer secrets following trust based initial access and prolonged detection latency.

What remains unknown

Despite the volume of public reporting, executive statements, and third party commentary surrounding this incident, material gaps remain in the public record. A rigorous analysis requires not only examining what is known but explicitly acknowledging what has not been disclosed or independently verified. 

The following unresolved questions represent significant gaps in publicly available information that are directly relevant to understanding the root cause, scope, and impact of this incident:

  • When Vercel first detected anomalous activity. The April 10 OpenAI notification received by a Vercel customer raises this question sharply. Vercel has not published an internal-detection timeline.
  • Why the nine-day gap between the earliest public evidence of credential abuse and Vercel's disclosure. Multiple explanations are plausible (coordinated disclosure, ongoing investigation, customer notifications in progress); the public record does not resolve which applies.
  • Number of affected customers. Rauch described the impact as "quite limited"; a specific count has not been disclosed.
  • Whether the ShinyHunters forum claims represent the same attacker. Whether the claims match the confirmed attack chain or a separate incident remains unverified.
  • Context.ai's current status and downstream-customer notifications. Whether Context.ai has published its own incident report or notified other customers is unknown.
  • Full scope of internal access. Vercel has described the customer impact as limited, but the precise number of affected teams, projects, and environment variables has not been publicly disclosed. Whether the attacker accessed internal systems beyond customer environment variables also remains unconfirmed.

Detection and hunting guidance

This section provides practical detection and hunting guidance for organizations potentially affected by the incident.

For Vercel customers (Immediate)

1. Audit all environment variables by entering the following code in Vercel projects to verify the configuration

# List all env vars across all Vercel projects via CLI
vercel env ls --environment production
vercel env ls --environment preview
vercel env ls --environment development

# Check which variables are NOT marked as sensitive
# (Vercel CLI does not currently expose the sensitive flag —
#  check via dashboard or API)

2. Search for unauthorized usage of exposed credentials

  • Query cloud provider CloudTrail/audit logs for API calls using exposed access keys from unexpected IP ranges or user agents.
    • AWS CloudTrail: Filter on eventSource containing sts.amazonaws.com, iam.amazonaws.com, s3.amazonaws.com. Search for userIdentity.accessKeyId matching any rotated Vercel-stored access key. Flag any sourceIPAddress outside your known CIDR ranges or any userAgent containing python-requests, curl, Go-http-client, or unfamiliar automation strings. Time window: February 2026 – present.
    • GCP Audit Logs: Query protoPayload.authenticationInfo.principalEmail for service accounts whose keys were stored in Vercel. Filter protoPayload.requestMetadata.callerIp against your known ranges. Look for protoPayload.methodName containing storage.objects.get, compute.instances.list, or iam.serviceAccountKeys.create from unexpected sources.
    • Azure Activity Logs: Filter on caller matching any application ID or service principal whose credentials were in Vercel env vars. Flag callerIpAddress outside expected ranges. Priority queries: Microsoft.Storage/storageAccounts/listKeys, Microsoft.Compute/virtualMachines/write, Microsoft.Authorization/roleAssignments/write.
  • Database access logs: For every database whose connection string was stored as a Vercel environment variable, query connection logs for the full exposure window (February 2026 – April 2026). Search for connections originating from IPs outside your application's known egress ranges (Vercel edge IPs, your VPN, your office). Flag connections using the exposed credentials that occurred outside normal deployment windows. For PostgreSQL: query pg_stat_activity and log_connections logs. For MySQL: query the general log or audit plugin. For MongoDB Atlas: query the Project Activity Feed for DATA_EXPLORER and CONNECT events from unknown IPs.
  • Payment processors: For Stripe, check the Dashboard → Developers → Logs for API calls using the exposed key. Filter for source_ip outside your servers. Look for /v1/charges, /v1/transfers, /v1/payouts, and /v1/customers calls you don't recognize. For Braintree/Adyen, query the equivalent API transaction logs. Priority: any api_key that was stored in Vercel as a non-sensitive env var and has not yet been rotated. Audit email sending service logs for unexpected sends.
  • Check for unsolicited leaked-credential notifications from OpenAI, Anthropic, GitHub, AWS, Stripe, and similar providers during the exposure window. These automated detection systems are now a primary early-warning channel for this class of breach.

3. Rotate AND redeploy

A critical operational detail to note is that a rotating Vercel environment variable does not retroactively invalidate old deployments. According to Vercel's documentation, prior deployments continue using the old credential value until they are redeployed.

Rotation without redeploy leaves the compromised credential live in any previous deployment artifact that is still reachable. Every credential rotation must be followed by a redeploy of every environment that used that variable, or the old deployments must be explicitly disabled.

  • Priority order for rotation:
  • Cloud provider credentials (AWS, GCP, Azure).
  • Database connection strings.
  • Payment processor keys.
  • Authentication secrets (JWT secrets, session keys).
  • Third-party API keys.
  • Monitoring and logging tokens.

For security teams (Proactive)

OAuth application audit — Google Workspace

  • Admin Console → Security → API Controls → Third-party app access.
  • Review all authorized OAuth applications.
  • Flag applications with broad scopes (Drive, Gmail, Calendar).
  • Investigate applications from vendors without active business relationships.
  • Monitor for OAuth token usage from unexpected IP ranges.
  • Search for the known-bad OAuth Client ID: 110671459871-30f1spbu0hptbs60cb4vsmv79i7bbvqj.apps.googleusercontent.com

Detection Logic for SIEM Implementation

The following detection patterns map to the confirmed attack chain stages. Each pattern describes the observable behavior, the log source to instrument, and the conditions that should trigger investigation. Organizations should translate these into rules native to their SIEM platform (Sigma, Splunk SPL, KQL, Chronicle YARA-L) after validating field names against their specific log source schemas.

OAuth application anomalies (Stages 1–2)

Monitor Google Workspace token and admin audit logs for three patterns. First, any token refresh or authorization event associated with the known-bad OAuth Client ID (110671459871-30f1spbu0hptbs60cb4vsmv79i7bbvqj.apps.googleusercontent.com) should trigger an immediate alert, this is the compromised Context.ai application.

Second, any OAuth application authorization event that grants broad scope (including full mail access, Drive read/write, calendar access) warrants review against your active vendor inventory; applications that are no longer in active business use should be revoked. Third, token usage from any authorized OAuth application where the source IP falls outside your expected corporate and vendor CIDR ranges should be flagged for investigation, as this may indicate token theft or application compromise.

Internal system access and lateral movement (Stage 3, T1078)

 Once attackers control a compromised Google Workspace account, they pivot into internal systems that trust that identity. Detection should focus on four indicators:

  • Anomalous SSO/SAML authentication events. Monitor your identity provider logs for the compromised Workspace account authenticating into internal applications (Vercel dashboard, CI/CD platforms, internal tooling) from unfamiliar IP addresses, geolocations, or device fingerprints — particularly first-time access to systems that account had never previously touched.
  • Email and Drive credential harvesting. Review Google Workspace audit logs for bulk email search queries (keywords like "API key," "secret," "token," "password," ".env"), unusual Google Drive file access patterns (opening shared credential stores, engineering runbooks, or infrastructure documentation), and mail forwarding rule creation on the compromised account.
  • OAuth-connected internal tool access. The compromised Workspace identity likely had existing OAuth grants to internal tools (Slack, Jira, GitHub, internal dashboards). Monitor those downstream services for session creation or API activity tied to the compromised user that occurs outside normal working hours or from infrastructure inconsistent with the user's historical access pattern.
  • Privilege escalation attempts. Watch for the compromised identity requesting elevated permissions, joining new groups or roles, or accessing admin consoles it had not previously used. In Google Workspace specifically, monitor for Directory API calls, delegation changes, or attempts to enumerate other users' OAuth tokens.

Environment variable enumeration (Stage 4)

Monitor Vercel team audit logs for unusual patterns of environment variable access. The specific event types will depend on Vercel's audit log schema, but the target behavior is any API call that reads, lists, or decrypts environment variables at a volume or frequency inconsistent with normal deployment activity.

Baseline your normal deployment cadence first — CI/CD pipelines legitimately read environment variables at build time — then alert access patterns that deviate from that baseline in volume, timing, or source identity. Pay particular attention to any environment variable access originating from user accounts rather than service accounts, or from accounts that do not normally interact with the projects being accessed.

Downstream credential abuse (Stage 5)

 For every credential that was stored as a non-sensitive Vercel environment variable during the exposure window (February 2026 – April 2026), query the corresponding service's access logs for usage from unexpected sources. In AWS, this means CloudTrail queries filtered on the specific access key IDs, looking for API calls from IP addresses outside your known application, CI/CD, and corporate ranges.

In GCP and Azure, the equivalent is audit log queries filtered on the relevant service account or application identity. For SaaS APIs (Stripe, OpenAI, Anthropic, SendGrid, Twilio), check the provider's dashboard or API logs for key usage from unrecognized IPs or during time windows when your application was not active. Any credential showing usage that cannot be attributed to your own infrastructure should be treated as compromised, rotated immediately, and investigated for what actions the attacker performed with it.

Third-Party credential leak notifications

Configure monitoring for unsolicited leaked-credential notifications from providers that operate automated secret scanning, including but not limited to GitHub (secret scanning partner program), AWS (compromised key detection), OpenAI, Anthropic, Stripe, and Google Cloud. These notifications are now a primary early-warning channel for platform-level credential exposure. Any such notification for a key that exists only in a deployment platform should be treated as a potential indicator of platform compromise, not routine key hygiene noise.

Threat hunting

Google Workspace Admin Console — manual search steps:

  1. Admin Console → Reports → Audit and Investigation → OAuth Log Events
  2. Filter: Application Name = "Context.ai" OR Client ID = 110671459871-30f1spbu0hptbs60cb4vsmv79i7bbvqj.apps.googleusercontent.com
  3. Date range: February 2026 – present
  4. Export all results. Any hits = immediate revocation and incident investigation.

Google Workspace — all third-party OAuth apps with broad scopes:

  1. Admin Console → Security → API Controls → Third-party app access → Manage Google Services
  2. Sort by: "App access" → "Unrestricted"
  3. For each app: verify (a) active vendor relationship exists, (b) scopes are justified by business use, (c) last-used date is recent. Any app not used in 90+ days: revoke.

Defensive recommendations

This section outlines defensive recommendations based on the confirmed attack tactics from this incident.

Immediate actions (0–48 hours)

  • Rotate all Vercel environment variables that were not marked as sensitive, regardless of whether you believe they were accessed. The cost of unnecessary rotation is trivial compared to the cost of a compromised credential.
  • Redeploy every environment after rotation — rotation alone does not invalidate old deployments.
  • Enable the sensitive flag on all environment variables containing any form of credential, token, key, or secret. Audit every project.
  • Audit OAuth application authorizations in your Google Workspace (or Microsoft Entra) admin console. Revoke access for any application that is no longer actively used.
  • Review access logs for all services whose credentials were stored as Vercel environment variables, covering the period February 2026 through present.

Short-term hardening (1–4 weeks)

  • Migrate secrets to a dedicated secrets manager (HashiCorp Vault, AWS Secrets Manager, Doppler, Infisical). Inject secrets at runtime rather than storing them as platform environment variables.
  • Implement OIDC-based authentication for CI/CD and deployment pipelines where supported, eliminating long-lived credentials entirely.
  • Deploy OAuth application monitoring — commercial solutions (Nudge Security, Grip Security, Valence Security) or Google Workspace's built-in OAuth app management.
  • Establish credential rotation automation — secrets should rotate on a defined schedule (30–90 days) regardless of incident status.
  • Treat OAuth grants as vendor relationships — add them to your third-party risk inventory alongside contracted vendors.

Architectural changes (1–6 months)

  • Adopt a zero-trust posture for environment variables — assume that any secret stored in a deployment platform may be exposed in a platform-level breach. Design systems so that a single credential exposure does not cascade.
  • Implement least-privilege scoping for all credentials — database credentials should have minimum required permissions, API keys should be scoped to specific operations, cloud credentials should use role-based temporary credentials rather than long-lived access keys.
  • Establish third-party vendor security review for any OAuth application or integration that accesses corporate identity systems. Include periodic re-review of existing authorizations.
  • Include PaaS platforms in your SBOM/ASPM inventory — this breach argues deployment platforms should be treated as tier-1 supply-chain dependencies, not external services.

Recommended monitoring

  • Audit Google Workspace Admin Console for the above OAuth Client ID.
  • Monitor Vercel audit logs for unexpected env.read or env.list API calls.
  • Review CloudTrail, GCP Audit Logs, and Azure Activity Logs for usage of credentials stored as Vercel env vars from unexpected IPs or user agents during February 2026 – April 2026.
  • Monitor for any of the LiteLLM or Axios-related IOCs published by their respective advisories if those packages are in your dependency tree.
  • Watch for unsolicited leaked-credential notifications from major API providers during the exposure window.

Regulatory and compliance implications

Organizations affected by credential exposure through the Vercel breach should evaluate notification obligations under:

  • GDPR (EU): If exposed credentials provided access to systems containing EU personal data, the 72-hour breach notification clock may have started upon confirmation of exposure. The April 10 OpenAI notification raises the question of whether some organizations' awareness predates Vercel's April 19 disclosure.
  • CCPA/CPRA (California): Exposure of credentials providing access to consumer data may trigger notification requirements.
  • PCI DSS: If payment processor credentials (Stripe, Braintree, Adyen) were exposed, PCI incident response procedures and forensic investigation requirements may apply.
  • SOC 2: Organizations with SOC 2 obligations should document the incident, credential rotation actions taken, and updated controls in their continuous monitoring evidence.
  • SEC Cybersecurity Rules (8-K): Public companies determining the breach is material have a 4-business-day disclosure obligation.

The challenge is that many organizations may not yet know whether the exposed credentials were actually used for unauthorized access — but regulatory frameworks often trigger on exposure, not confirmed exploitation.

Conclusion

The Vercel breach is not an isolated incident — it is the latest manifestation of a structural vulnerability in how the software industry manages secrets and trust relationships. In the span of three weeks, we have seen:

  • LiteLLM: CI/CD credentials stolen → malicious packages harvesting developer secrets at scale.
  • Axios: Maintainer account hijacked → RAT deployed to millions of developer environments.
  • Vercel: OAuth application compromised → internal access enabling enumeration of a limited subset of customer deployment secrets, with at least one public report suggesting downstream credential abuse detected in the wild prior to disclosure.

Each attack targets a different link in the software supply chain. Together, they paint a picture of an ecosystem where credentials are the universal target and trust relationships are the universal attack surface. The cascade the industry has warned about is no longer purely theoretical.

The defensive path forward is clear, if not easy:

  • Stop storing long-lived credentials in platform environment variables. Use dedicated secret managers with runtime injection.
  • Stop trusting OAuth applications implicitly. Audit, monitor, and periodically re-authorize.
  • Stop assuming your platform provider's internal security posture. Design for the scenario where they are breached.
  • Start rotating credentials proactively — and remember to redeploy afterward.
  • Treat leaked-credential notifications from third-party providers as high-priority early-warning signals, not routine noise.

The organizations that will weather the next platform breach are those that assumed it would happen and built their credential architecture accordingly.

Indicators of Compromise (IoCs)

Confirmed IoC

Type Value Context

OAuth Client ID

110671459871-30f1spbu0hptbs60cb4vsmv79i7bbvqj.apps.googleusercontent.com

Compromised Context.ai OAuth application

↑ top

5.San Diego rents declined more than 19 of 20 top US markets after surge in supply

Sourcehttps://www.kpbs.org/news/economy/2026/03/27/san-diego-rents-declined-more-than-19-of-nations-top-20-markets-following-surge-in-supply

SiteKPBS

AuthorJake Gotta

Published2026-03-27

HN activity96 points · 56 comments

Length676 words (~3 min read)

Languageen

Rents in San Diego for a 1-bedroom apartment decreased by 5.6% year-over-year, more than every city in the top 20 priciest markets except New Haven, CT

By Jake Gotta / Social Media Host and Reporter

Published March 27, 2026 at 1:49 PM PDT

San Diego rents have gone down since this time last year, according to a new report by Zumper, a rental platform that tracks rental data nationwide.

The median rent for a 1- and 2-bedroom apartment in San Diego declined by 5.6% and 7.5%, respectively.

The report found that there was about a 15% increase in active listings in San Diego over that timeframe, according to Crystal Chen from Zumper.

“Generally speaking, the more supply there is, the less the prices will continue to increase,” Zack Defazio-Farell from the housing advocacy group YIMBY Democrats of San Diego said. “And they may go down as we're starting to see here. So yeah. Shouldn't be too surprised by this.”

Of the top 20 most expensive rental markets, only New Haven, Conn., saw a sharper decline in 1-bedroom rents. Miami and New Haven both saw larger decreases in median rents for a 2-bedroom apartment.

Most other cities in the top 20 with fewer new active listings didn’t see the same decline.

visualization

“I think if you track the city of San Diego over the last couple of years, we've shown a pretty significant increase in the number of new housing permits each year, we’re closing in on the 10,000 mark for the last two years,” Council President Pro Tem Kent Lee said. “And I think that's really a collective effort between the mayor's office, a supportive council, and our planning and development services department that are trying to find, really all the tools in which they can help to ensure that new housing is happening in San Diego.”

Lee chairs the city council’s Land Use and Housing Committee. He said one of the biggest ways the city has facilitated new housing is through the community plan updates, like the recent updates in Clairemont and the College area.

“When we have this big influx of housing supply, it means that as a renter, it's much more competitive,” Lee said.

Defazio-Farell said that makes it more difficult for landlords or owners to charge higher prices.

“If you are someone who's in the market looking for a rental, right, looking for a new apartment, when you have more options, it allows you to be more selective, right?” Defazio-Farell said. “So it gives you a certain degree of negotiating power that you wouldn't otherwise necessarily have.”

KPBS reported last year that rents in San Diego increase slower where lots of homes are permitted; the Zumper report continues to indicate that adding to the supply of available homes on the market helps keep rents from increasing, and can even contribute to decreases.

And the Zumper report says that places with lots of new homes are better for renters.

“Peak deliveries are now arriving after peak demand, pushing inventory higher and intensifying competition among property owners,” the Zumper report said. “As a result, many markets are seeing downward pressure on rents, increased concessions, and more choice for renters.”

Mayor Todd Gloria said in a social media post that the city’s pro-housing policies are working.

“When we #BuildMoreHomes, we expand opportunity, ease pressure on costs, and help prevent homelessness,” the post read. “We are not slowing down.”

Nationally, median 1-bedroom rents were down 1.4% and 2-bedroom rents were down 1.3% since last year. But there was a small increase in the past month, according to data from Zumper.

San Diego sits at the 11th most expensive rental market in the nation, according to the report, with the median rent for a 1-bedroom at $2,200. Median rent for 2-bedroom apartments is $2,950.

“I think anytime we see that rents are dropping in what is one of the most expensive places in the country to live, it's obviously a very positive result,” Lee said. “It tells us that some of what we have been doing at the city is actually working. And it's just the tip of the iceberg. It means that we actually have to have a lot more work to do.”

↑ top

6.CrabTrap: An LLM-as-a-judge HTTP proxy to secure agents in production

Sourcehttps://www.brex.com/crabtrap

SiteBrex

Submitterpedrofranceschi (Hacker News)

Submitted2026-04-21 15:29 UTC (Hacker News)

HN activity90 points · 24 comments

Length365 words (~2 min read)

Languageen-US

CrabTrap is an LLM-as-a-judge HTTP proxy to secure agents in production. It intercepts and audits AI agent requests in real time. Try it on GitHub now.

Brex LLC is a wholly owned subsidiary of Capital One, N.A.

Brex LLC | 650 S 500W Suite 300 | Salt Lake City, UT 84101

The Brex business account consists of Checking, a commercial checking account provided by Column N.A., Member FDIC (an unaffiliated institution), and Treasury and Vault, cash management services provided by Brex Treasury LLC, Member FINRA/SIPC and a Capital One company.

Securities are offered through Brex Treasury LLC. Funds in Treasury are not FDIC-insured. Funds in Vault at program banks are eligible for FDIC insurance. Funds are not FDIC-insured until they arrive at program banks. Conditions apply.

Investing in securities involves risk and loss of money. Yield and return are variable and fluctuate. Past performance is not a guarantee of future results. This is not an offer to, or implied offer, or a solicitation to, buy or sell any securities. Brex Treasury LLC does not provide legal, tax, or investment advice. The latest statement of financial condition for Brex Treasury LLC is available here. You could lose money by investing in the Fund. Although the Fund seeks to preserve the value of your investment at $1.00 per share, it cannot guarantee it will do so. An investment in the Fund is not insured or guaranteed by the FDIC or any other government agency.

The Brex Mastercard® Corporate Credit Card is issued by Emigrant Bank, Fifth Third Bank N.A., or Airwallex (Netherlands) B.V. (all unaffiliated institutions), pursuant to licenses by Mastercard International Inc. Mastercard is a registered trademark, and the circles design is a trademark of Mastercard International Inc. The Brex Commercial Card is issued by Sutton Bank (an unaffiliated institution), pursuant to a license from Visa® U.S.A. Inc. Can be used where Visa® cards are accepted. No ATM access. All loans are subject to approval, including underwriting, credit, and collateral approval, as well as availability restrictions. Nothing herein should be construed as a commitment to lend.

Certain payment services are provided by Brex Payments LLC, a licensed money transmitter (NMLS #2035354) and a Capital One company.

Some Brex products have associated fees. Plans start at $0 per user, per month, and more advanced features are available for $12 per user, per month.

↑ top

7.Laws of Software Engineering

Sourcehttps://lawsofsoftwareengineering.com

SiteLaws of Software Engineering

AuthorDr. Milan Milanović

Submitted2026-04-21 11:04 UTC (Hacker News)

HN activity859 points · 430 comments

Length22 words (~1 min read)

Languageen-us

A collection of principles and patterns that shape software systems, teams, and decisions.

A collection of principles and patterns that shape software systems, teams, and decisions.

56 laws Click any card to learn more

↑ top

8.Britannica11.org – a structured edition of the 1911 Encyclopædia Britannica

Sourcehttps://britannica11.org/

SiteEncyclopædia Britannica, 11th Edition

Submitterahaspel (Hacker News)

Submitted2026-04-21 17:33 UTC (Hacker News)

HN activity238 points · 91 comments

Length12 words (~1 min read)

Languageen

A fully searchable, cross-referenced, and annotated digital edition of the 1910–1911 Encyclopædia Britannica.

Encyclopædia Britannica

Eleventh Edition · 1910–1911

∼◆∼

Title page of the Encyclopædia Britannica, 11th Edition, Volume I (1910)

Fully searchable, cross-referenced, and annotated

↑ top

9.Stephen's Sausage Roll remains one of the most influential puzzle games

Sourcehttps://thinkygames.com/features/10-years-of-grilling-stephens-sausage-roll-remains-one-of-the-most-influential-puzzle-games-ever-created/

SiteThinky Games

AuthorTeam Thinky

Submitted2026-04-18 10:53 UTC (Hacker News)

HN activity145 points · 70 comments

Length876 words (~4 min read)

Languageen

Happy 10th anniversary to Stephen's Sausage Roll! We asked a handful of developers why it remains a puzzle game masterpiece to this day.

Today marks 10 years since Stephen's Sausage Roll released on PC and changed puzzle games forever. A sokoban game where you use an oversized fork to cook chunky sausages, it's become known for its meticulous puzzle design and tough-as-nails difficulty, winning the hearts (and minds) of puzzle-lovers and aspiring game developers. The influence that the game has had on the thinky community and the puzzle games we love is immeasurable, so here at Thinky Games, we’d like to join in the celebrations and put a party hat on for what we consider a puzzle game masterpiece. 

When game designer Stephen Lavelle (Increpare Games) released Stephen's Sausage Roll back in April 2016, it was accompanied by a trailer that showed almost nothing about the game, yet word still spread quickly. Puzzle developers and fans praised the game for its impeccable design, teasing out layers of deep puzzling and mind-expanding discoveries from so few puzzle elements. It was also renowned for its uncompromising, yet always fair, difficulty curve, with immensely challenging puzzles from the very start. These sentiments are still held to this day, as this beloved sausage-pushing sokoban continues to influence new generations of puzzle developers, inspiring some of the best sokoban games ever made and introducing "Sausage-likes” to the puzzle vernacular.

A few years prior to Stephen's Sausage Roll, Stephen Lavelle also released PuzzleScript, a web-based game engine for creating grid-based puzzle games, giving developers an incredibly powerful way explore sokoban game design. With both Stephen's Sausage Roll and PuzzleScript, it's safe to say Lavelle has had an incredible influence on modern thinky puzzle games.

To celebrate the game's 10-year anniversary, we asked a handful of developers how Stephen's Sausage Roll has influenced their own puzzle games, design philosophies, and creative visions. You’ll find their words below.

So, on that note, Happy 10th Birthday to Stephen's Sausage Roll! 


"Stephen's Sausage Roll is a masterclass of doing a lot with a little - taking a small number of game elements, never adding anything new, but constantly surprising you with the consequences of the mechanics that were always there. Other games have followed this design ethos since (our game A Monster's Expedition among them), but they all stand on the shoulders of this beautiful tower of sausages." Alan Hazelden (Draknek & Friends, A Monster's Expedition, Spooky Express, Sokobond)

"Player. Fork. Sausage. Grill. Block. Ladder. So much comes from just these 6 objects! Stephen's Sausage Roll masterfully harnesses and explores the deep mathematical richness of sokoban-like systems. And yet, the physical metaphors of these objects keep the ruleset understandable, intuitive, human-relatable, and make the surprising consequences and absurd constructions that much more amazing. SSR exemplifies the qualities of Stephen's huge lineage of sokoban-like games. On a personal note - SSR inspired me to take Patrick's Parabox in a non-action, pure-puzzle direction! And it inspired me to put my name in my game's title!" Patrick Traynor (Patrick’s Parabox, Linelith)

"When Stephen’s Sausage Roll was first recommended to me I was not a puzzle gamer. I played mostly AAA RPGs. I had a background in AAA art, and I was rather unimpressed with SSR’s aesthetics. At my friend's behest I begrudgingly gave this game and shot, and it changed the course of my career. Stephen’s Sausage Roll was a gateway drug into sokobans in general. I spent hours playing Pipe Push Paradise, then Alan Hazelden’s games, the various sokoban puzzlescript experiments, and so on. I eventually left my indie gig and developed two sokoban titles of my own – Kine and then Lab Rat. None of this would have happened if it wasn't for SSR. I'm so, so grateful that this game exists." Gwen Frey (Kine, Lab Rat)

"Discovering Stephen's Sausage Roll was so creatively exciting for me. Everything about it had this radical stripped-down purity. 3 inputs, no time pressure, no reflex-based pressure, and yet somehow among the richest experiences I had ever had with a game. It was like 'the Ramones in 1976' of video games. Similar to Fumito Ueda's games like Ico and Shadow of the Colossus, it pushed back, for me at least, on the expectation of these superficial layers we came to expect in a game. It stretched out my understanding of what a game could be and made me realise those boundaries would continue to stretch, and gosh, how inspiring. I wanted to be a part of it." Corey Martin (Bonfire Peaks, Pipe Push Paradise)

"Stephen's Sausage Roll taught me to love sokoban. It may have taken me two attempts to get into it, but by the time I'd finally cooked that last sausage, I was a sokoban fan for life. For me, Stephen's Sausage Roll marks a clear shift from classic fiddly sokoban design to the kind of beautiful, deep, insightful, and focused puzzle design we look for in all modern thinky games. Not only that, but both it and the many hundreds of games it has inspired have proven that sokoban, as a puzzle framework, is an unbelievably rich space with still so much to explore." Joseph Mansfield (Thinky Games)


Learn more about Stephen's Sausage Roll in our database of thinky games, where you can also find similar games and some of the best sokoban games ever made.

↑ top

10.The Mystery in the Medicine Cabinet: Acetaminophen, ibuprofen, and what to know

Sourcehttps://asteriskmag.com/issues/14/the-mystery-in-the-medicine-cabinet

SiteAsterisk Magazine

AuthorDynomight

Published2026-04-15

HN activity41 points · 5 comments

Length3.5K words (~16 min read)

Languageen

Acetaminophen, ibuprofen, and what doctors probably want you to know.

Dynomight

Acetaminophen, ibuprofen, and what doctors probably want you to know.

Lots of people die after overdosing on acetaminophen (paracetamol, often sold as Tylenol or Panadol). In the U.S., it’s estimated to cause 56,000 emergency department visits, 2,600 hospitalizations, and 500 deaths per year. Acetaminophen has a scarily narrow therapeutic window. The instructions on the package say it's okay to take up to four grams per day. If you take eight grams, your liver could fail and you could die. 

Meanwhile, it seems to be really hard to kill yourself by overdosing on ibuprofen (Advil, Nurofen, Motrin, Brufen). In 2006, Wood et al. searched the medical literature and found 10 documented cases in history. Nine of those cases involved complicating factors, and in the 10th, a woman took the equivalent of more than 500 standard (200mg) pills. 

So, for many years, if I needed a painkiller, I’d try to take ibuprofen rather than acetaminophen. My logic was that if eight grams of acetaminophen could kill my liver, then one gram was probably still hard on it. I’m fond of my liver and didn't want to cause it any unnecessary inconvenience. 

But guess what? My logic was wrong and what I was doing was stupid. I’m now convinced that for most people in most circumstances, acetaminophen is safer than ibuprofen, provided you use it as directed. I think most doctors agree with this. In fact, I think many doctors think it’s obvious. (Source: I asked some doctors; they said it was obvious.) 

Should this have been obvious to me? I figured it out by obsessively researching how those drugs work and making up a story about metabolic pathways and blood flow, and amino acid reserves. It’s a good story, one that revealed that my logic stemmed from an egregious lack of respect for biology and that I’m a big dummy (always a favorite subject). But if the clearest road to some piece of knowledge runs through metabolic pathways, then I don't think that knowledge counts as obvious. 

So how is a normal person meant to figure it out? Why doesn't the fact that acetaminophen is typically safer than ibuprofen appear on drug labels or government websites or WebMD? Are normal people supposed to figure it out, or has society decided that this is the kind of thing best left illegible? 

Note: You should not switch medications based on the uninformed ramblings of non-trustworthy pseudonymous internet people.

illustration
Jul Quanouai

How does ibuprofen work?

Ibuprofen inhibits the body’s production of the Cyclooxygenase (COX) enzyme. This in turn inhibits the formation of messenger molecules involved in inflammation, which leads to less physical inflammation and thus less pain. 

The same story is true for almost all over-the-counter painkillers, which is why they’re almost all considered “non-steroidal anti-inflammatory drugs,” or NSAIDs. This includes ibuprofen, aspirin, naproxen (Aleve), and a long list of related drugs. But it does not include acetaminophen.

How does acetaminophen work?

Nobody knows!

Like ibuprofen, acetaminophen inhibits some COX enzymes. But it does so in a weird way that barely affects inflammation or messenger molecules, so it’s unclear if this matters for pain reduction. 

In the brain,  acetaminophen is metabolized into a mysterious chemical called AM404. This activates the cannabinoid receptors and increases endocannabinoid signaling, which seems to reduce the subjective experience of pain. AM404 also activates the capsaicin receptor, which is associated with burning sensations that you’d normally expect to increase pain, but maybe some desensitization thing happens downstream? And maybe acetaminophen also interacts with serotonin or nitric oxide or does other stuff? How this all comes together to reduce pain is still somewhat a scientific mystery. 

Aside: When trying to understand painkillers, it’s natural to focus on chemistry and molecular biology. But the unknown physical origins of consciousness are always nearby, looming ominously.

What risks does ibuprofen have?

In an ideal world, the only thing ibuprofen would do is reduce inflammation in the part of your body that hurts. But that is not our world. When ibuprofen inhibits the COX enzymes, it does so throughout the body. And mostly, that is bad. 

For one, ibuprofen reduces production of mucus in the stomach. That might sound okay or even good. But stomach mucus is important. You need it to shield the lining of your stomach from your extremely acidic gastric juice.1 Having less mucus can lead to gastrointestinal problems or even ulcers. 

Ibuprofen also affects the heart. When ibuprofen inhibits the COX enzymes there, this in turn inhibits one chemical that prevents clotting and another that causes clotting. In balance, this seems to lead to more clotting, and an increased statistical risk of heart attacks 2 . If you’re healthy, the risk of a heart attack from an occasional low dose of ibuprofen is probably zero. But if you have heart issues and take medium to large doses regularly for as little as a few days, this might  be a serious concern. 

Ibuprofen also affects the kidneys. If you’re stressed, or cold, or dehydrated, or take stimulants, your body will constrict your blood vessels. That squeezes your kidneys’ intake tube, depriving them of blood. Your kidneys don’t like that, so they release signaling molecules to locally re-dilate the blood vessels. 

Trouble is, when ibuprofen inhibits COX enzymes in the kidneys, it inhibits those signaling molecules. If everything is normal, that’s okay, because the kidneys wouldn’t try to use those molecules anyway. But if your body has clamped down on the blood vessels, then the kidneys don’t have the tool they use to keep blood flowing, meaning they don’t get as much blood as they want. This is bad.3

There are many other less common side effects, including allergies, respiratory reactions in asthmatics, induced meningitis, and suppressed ovulation. If you take a lot of ibuprofen, this could hurt your liver. But the major concerns seem to be the stomach, the heart, and the kidneys.

What risks does acetaminophen have?

Acetaminophen also inhibits some COX enzymes. But unlike ibuprofen, the effect is minimal outside the central nervous system. Thus, acetaminophen has little effect on stomach mucus, blood clots, or blood flow, and so presents almost none of the risks that ibuprofen does. 

Even so, if you take too much acetaminophen at once, you could easily die. 

How does this happen? Well, when acetaminophen is metabolized by the liver, it’s mostly broken down into harmless stuff. But a small fraction (5-15%) is broken down by the P450 system into an extremely toxic chemical called NAPQI

Ordinarily this is fine; your body creates and neutralizes toxic stuff all the time. For example, if you drank 20 grams of formaldehyde, you’d likely die. But did you know that your body itself makes and processes ~50 grams of formaldehyde every day? When liver cells sense NAPQI, they immediately release glutathione, which binds to NAPQI and renders it harmless. 

But there’s a problem. If you take too much acetaminophen at once, the pathways that break it down into harmless stuff get saturated, but the P450 system doesn’t get saturated. This means that not only is there more acetaminophen, but also that a much larger fraction of it is broken down into NAPQI. Soon your liver cells will run out of glutathione to neutralize it. Then, NAPQI will build up and bind to various proteins in the liver cells (especially in mitochondria) causing them to malfunction and/or commit suicide. This can cause total liver failure. 

So you should never take more than the recommended dose of  acetaminophen.4 If you do take too much, you should go to a hospital immediately. They will give you NAC, which will replenish your glutathione and neutralize the NAPQI. Your prospects are good as long as you get to the hospital within a few hours. 5 6

Acetaminophen has lots of other possible side effects, like skin issues and blood disorders. But these all seem to be quite rare.

What if you have liver issues?

The primary concern with acetaminophen  is liver damage. So if you have liver disease, then surely you’d want to avoid acetaminophen and take ibuprofen instead, right? 

Nope. It’s the opposite. Liver disease shifts the balance of risk in favor of acetaminophen. 

With liver disease, it’s hard for blood to flow into the liver, meaning that blood tends to pool in the abdomen. To counter this, blood vessels elsewhere in the body contract. This includes blood vessels around the kidneys. 

Remember the kidneys? Again, when blood vessels are constricted, the kidneys send out signaling molecules to locally re-dilate the blood vessels. But those signaling molecules are blocked by ibuprofen. So if you have liver disease, taking ibuprofen risks starving your kidneys of blood just like if you were dehydrated.

Meanwhile, people with moderate liver disease are usually still able to process acetaminophen without issue, as long as it’s in smaller amounts. So doctors usually tell patients with liver disease to avoid ibuprofen and take  acetaminophen instead, just with a maximum of two grams per day instead of four. 

(Obviously, if you have liver disease, then you should talk to a doctor, I beg you, for the love of god.)

What about other situations?

The main takeaway from all this is that the risks of both drugs emerge from the madhouse of complexity that is your body. Surely there are some situations where acetaminophen is more dangerous than ibuprofen?

I tried to capture the most common situations in this table:

chart

It’s actually fairly hard to find situations where ibuprofen is safer than acetaminophen. Possibly this is true if you’re hungover, but I would be very careful, because you tend to be dehydrated when hungover, raising the risk of kidney damage. (It’s probably optimal, from a health perspective, to avoid taking recreational drugs at doses that leave you physically ill the next day.) 

Aside from hangovers, the only situations I could find where ibuprofen might be safer than acetaminophen  are if you’re taking certain anti-seizure or tuberculosis drugs or maybe if you have a certain enzyme deficiency (G6PDD). 

So...

What have we learned so far? 

1. The body is really complicated! 

2. The main risk of acetaminophen is liver damage by creating too much NAPQI. Taking too much at once can easily kill you. However, as long as you don’t take too much at once and your liver isn’t depleted, then your liver will maintain NAPQI levels at zero and it will be completely fine. And there are very few other risks. 

3. Meanwhile, ibuprofen poses a risk of gastrointestinal issues, heart attacks, or kidney damage. The risk varies based on lots of factors like whether you’ve eaten food, whether you’re dehydrated, your blood pressure, and your heart health.7

4. Therefore, acetaminophen is probably safer, provided you never take too much.8

I don’t want to be alarmist. If you’re healthy, the risk from taking an occasional dose of ibuprofen as directed is extremely low. Given that so many people find that ibuprofen is more effective for many kinds of pain, it’s totally reasonable to use it. I do so myself. 

Still, it seems to be the case that in the vast majority of situations, acetaminophen is safer. Personally, if I have pain, I first take acetaminophen, and then add ibuprofen if necessary. I’m pretty sure many experts think this is somewhere between “sensible” and “obvious.” 

But if acetaminophen is safer, then why don’t official sources tell you that?9 I can get doctors to admit this off-the-record. I can find random comment threads with support from people who seem to know what they’re talking about. But why does this fact never appear on government websites or drug labels? 

Let’s look at those drug labels

In the U.S., the Food and Drug Administration (FDA) creates10 a “drug facts” label for over-the-counter drugs.  

Here’s what that looks like for ibuprofen:

label

And here’s what it looks like for acetaminophen (acetaminophen):

label

I feel dumb saying this, but when I saw those labels in the past, I thought of them as a bunch of random information thrown together for legal reasons. But after spending a lot of time trying to understand these drugs myself, I now realize that these labels are... really good? 

Imagine you work at the FDA and it’s your job to write a safety label. You need to synthesize a vast and murky scientific landscape. Your label will be read by people with minimal scientific background who are likely currently in pain, and who could die if they take the drug in the wrong situation. 

If I were in that situation, I’d think about all the different situations in which taking one of these drugs could literally kill someone, and then — after a quick panic attack — I’d write a label that screamed, HEY, IF YOU ARE IN ANY OF THESE SITUATIONS, TAKING THIS DRUG COULD LITERALLY KILL YOU. Then I’d think about all the other situations where taking the drug might be okay depending on a set of complex science stuff and tell people in those situations to PLEASE TALK TO A DOCTOR FOR THE LOVE OF GOD because I DON’T KNOW IF YOU’VE HEARD BUT SCIENCE IS COMPLICATED. Everything else would be a minor concern.

From that perspective, these labels are a triumph. This isn’t random information — every word is a synthesis of a mountain of research, carefully optimized to save lives.

FDA good

How did those drug labels come to be? 

If you want a taste for the FDA’s process, I encourage you to skim the 2002 Federal Register document in which the FDA proposed to update ibuprofen’s safety label and to formally classify it as Generally Recognized as Safe. It’s more than 21,000 words long and — I think — astonishingly good. It not only summarizes the entire medical literature on ibuprofen, it summarizes it well. Here is onerepresentative bit:

Bradley et al. (Ref. 42) conducted a 4-week, double-blind, randomized trial in 184 subjects comparing the effectiveness and safety of the maximum approved OTC daily dose of 1,200 mg of ibuprofen (number of subjects (n) = 62) to that of a prescription dose of 2,400 mg/day (n = 61), and to 4,000 mg/day of acetaminophen (n = 59) for the treatment of osteoarthritis. While there were no significant differences in the number of side effects reported during this study, the study demonstrated a trend towards a dose dependent increase in minor GI adverse events (nausea and dyspepsia) associated with higher doses of ibuprofen (1,200 mg/day: 7/62 or 11.3 percent; versus 2,400 mg/day: 14/61 or 23 percent). In addition, two subjects treated with 2,400 mg/day of ibuprofen became positive for occult blood while participating in the study.

I spend a lot of time complaining about bad statistical writing. A lot. Probably too much. But I’m here to tell you, that paragraph is gorgeous. The writing is clear and penetrating. It contains all the important details, but no other details. Compared to the abstract of the original paper, the above is shorter and easier to understand yet simultaneously more informative. Five stars. 

The rest of the document is equally good, with clear and sensible explanations for various recommendations. For example, they discuss a proposal from the National Kidney Foundation for additional warning about risks to kidneys, explain why they think that proposal has merit, and then recommend a shorter version, which appears on every package of ibuprofen sold today. 

As far as I can tell, this level of quality is typical. For example, the FDA’s 2019 proposed rule on sunscreens is similarly masterful.

So why?

This leaves us with this constellation of facts: 

1. Acetaminophen is, in general, safer than ibuprofen. 

2. The FDA doesn’t tell you that. Neither do other respectable authorities. 

3. The FDA is highly competent.

So what’s happening here? Have the experts conspired to keep this knowledge secret? 

I don’t think so. Mostly, I think this is down to two factors. First, the FDA doesn’t really have a mission of determining “in what circumstances is drug A safer than drug B?” Their goal is to take individual drugs and determine how people can use them safely. They seem to be quite good at this. 

Second, everyone is mortally afraid of giving “medical advice.” It varies by jurisdiction, but in general, giving "wellness advice" is OK, but if you give personalized advice, you risk going to prison. The more credible you are, the higher that risk is.11  

Stepping back, how should we think about this situation? 

The body is complicated. When experts give the public advice on drugs, they are trying to insulate us from that complexity. But there is no way to do that without making trade-offs. Society has implicitly chosen tradeoffs that mean certain "less important" facts are de-prioritized. It’s not obvious that this is the wrong choice. I feel foolish for not having more respect for the body’s complexity and for the difficulty of the task all the experts are trying to accomplish. This is not medical advice.

  1. For some reason, humans have gastric acid that is more acidic than most other animals, and is only matched by animals that specialize in eating carrion.
  2. At least two NSAIDs (rofecoxib and valdecoxib) have been withdrawn from the market due to an increased risk of heart attacks. For the same reason, the US refuses to approve etoricoxib.
  3. Nephrologists hate ibuprofen. (Source: nephrologists.) If it was up to them, maybe ibuprofen would come with a “HAVE YOU CONSIDERED TAKING ACETAMINOPHEN INSTEAD?” warning. It confuses me that the safety label for ibuprofen doesn’t warn you about the danger of taking it while dehydrated and quietly damaging your kidneys. My best guess is that this is because other doctors don’t hate ibuprofen as much as nephrologists.
  4. Watch out for combination medicines (like cold or flu medicines or opiate painkillers) that include acetaminophen. Arguably, acetaminophen is a victim of its own success here. It’s included in these things because it is better tolerated than NSAIDs. But it’s easy to miss.
  5. Oddly, NAC is considered a nutritional supplement, meaning basically anyone can buy it. But there’s also almost no regulation, so who knows if the thing you bought actually has NAC in it? Do not screw around trying to self-medicate an acetaminophen overdose. Go to a hospital.
  6. At one point while researching all this I had what I thought was a good idea: Why not sell acetaminophen in pills bundled together with NAC? The NAC would replenish glutathione stores in the liver, seemingly reducing the risk of overdose. Later on, I developed more humility and felt very stupid for fantasizing that such an obvious idea could be novel or useful. I think that this is indeed a bad idea because NAC itself has side effects, though I can’t find much formal discussion. In fact, I found a 2010 editorial called "Why Not Formulate an Acetaminophen Tablet Containing N-Acetylcysteine to Prevent Poisoning?"  In another study, Nakhaee et al. (2021) actually tried giving NAC together with acetaminophen to rats and found that this seemed to make it better at reducing pain. So maybe this isn’t a completely stupid idea. That last paper also led me to discover that “rat hot plate test” is a standard phrase, and one that drives home what humanity’s dominion over nature means in practice.
  7. Above, we mentioned that acetaminophen overdose is estimated to cause around 500 deaths per year in the U.S. It’s much harder to give direct numbers for how many people die from taking ibuprofen, because NSAIDs don’t really directly “kill” people, but rather increase the risk of dying in various ways. The best estimates seem to be that NSAIDs cause 5,000-16,500 deaths each year in the US via gastrointestinal complications, and something similar via heart attacks. These numbers are not a good way of quantifying the relative risk of drugs, because they represent different people taking different amounts for different reasons. But they do show that ibuprofen is not without risk.
  8. There are probably some people who are too disordered to track much acetaminophen they’ve taken. For such people, ibuprofen might be the safer choice. Though I’m skeptical that many such people are found among the readers of Asterisk.
  9. There are two cases where official sources are clear that acetaminophen is safer than ibuprofen: for use by pregnant women and small children. This doesn’t appear on the safety label, but if you’re pregnant and go to a doctor, they will probably tell you to take acetaminophen but not ibuprofen or other NSAIDs. And if you have a newborn baby, their doctor will probably tell you that you can give them acetaminophen but not ibuprofen or other NSAIDs.
  10. Technically, for many drugs today, it is the drug manufacturer that "creates" the label, which is why they can be slightly different. However, the FDA strongly regulates what is on it, including most of the language and even details about the font and so on. The federal register contains a template the FDA published for ibuprofen which is almost identical to what appears on the side of drugs today 
  11. Unlike in most places, in the United Kingdom it seems to be perfectly legal for people to give each other medical advice, provided they don’t misrepresent themselves as licensed doctors. This is not legal advice.

↑ top

11.Framework Laptop 13 Pro

Sourcehttps://frame.work/laptop13pro

Siteframe.work

SubmitterTrollmann (Hacker News)

Submitted2026-04-21 18:00 UTC (Hacker News)

HN activity989 points · 535 comments

[scrape failed: http 403]

↑ top

12.Drunk Post: Things I've Learned as a Senior Engineer

Sourcehttps://luminousmen.substack.com/p/drunk-post-things-ive-learned-as

SiteBlog | luminousmen

Authorluminousmen

Published2026-04-21

HN activity35 points · 10 comments

Length3.7K words (~16 min read)

Languageen

Everything your mentor wants to say but HR won't let them

A few years ago, a data engineer on r/ExperiencedDevs got drunk and wrote down everything he learned in 10 years of engineering. The original account is deleted, but the post captures something real — the kind of honesty you only get after a few glasses of wine. Preserving it here, typos and all.

Contains the language you’d expect from someone who opened with ‘I’m drunk’.

I’m drunk and I’ll probably regret this, but here’s a drunken rank of things I’ve learned as an engineer for the past 10 years.

  • The best way I’ve advanced my career is by changing companies.

  • Technology stacks don’t really matter because there are like 15 basic patterns of software engineering in my field that apply. I work in data so it’s not going to be the same as webdev or embedded. But all fields have about 10-20 core principles and the tech stack is just trying to make those things easier, so don’t fret overit.

  • There’s a reason why people recommend job hunting. If I’m unsatisfied at a job, it’s probably time to move on.

  • I’ve made some good, lifelong friends at companies I’ve worked with. I don’t need to make that a requirement of every place I work. I’ve been perfectly happy working at places where I didn’t form friendships with my coworkers and I’ve been unhappy at places where I made some great friends.

  • I’ve learned to be honest with my manager. Not too honest, but honest enough where I can be authentic at work. What’s the worse that can happen? He fire me? I’ll just pick up a new job in 2 weeks.

  • If I’m awaken at 2am from being on-call for more than once pesr quarter, then something is seriously wrong and I will either fix it or quit.

pour another glass

  • Qualities of a good manager share a lot of qualities of a good engineer.

  • When I first started, I was enamored with technology and programming and computer science. I’m over it.

  • Good code is code that can be understood by a junior engineer. Great code can be understood by a first year CS freshman. The best code is no code at all.

  • The most underrated skill to learn as an engineer is how to document. Fuck, someone please teach me how to write good documentation. Seriously, if there’s any recommendations, I’d seriously pay for a course (like probably a lot of money, maybe 1k for a course if it guaranteed that I could write good docs.)

  • Related to above, writing good proposals for changes is a great skill.

  • Almost every holy war out there (vim vs emacs, mac vs linux, whatever) doesn’t matter... except one. See below.

  • The older I get, the more I appreciate dynamic languages. Fuck, I said it. Fight me.

  • If I ever find myself thinking I’m the smartest person in the room, it’s time to leave.

  • I don’t know why full stack webdevs are paid so poorly. No really, they should be paid like half a mil a year just base salary. Fuck they have to understand both front end AND back end AND how different browsers work AND networking AND databases AND caching AND differences between web and mobile AND omg what the fuck there’s another framework out there that companies want to use? Seriously, why are webdevs paid so little.

  • We should hire more interns, they’re awesome. Those energetic little fucks with their ideas. Even better when they can question or criticize something. I love interns.

sip

  • Don’t meet your heroes. I paid 5k to take a course by one of my heroes. He’s a brilliant man, but at the end of it I realized that he’s making it up as he goes along like the rest of us.

  • Tech stack matters. OK I just said tech stack doesn’t matter, but hear me out. If you hear Python dev vs C++ dev, you think very different things, right? That’s because certain tools are really good at certain jobs. If you’re not sure what you want to do, just do Java. It’s a shitty programming language that’s good at almost everything.

  • The greatest programming language ever is lisp. I should learn lisp.

  • For beginners, the most lucrative programming language to learn is SQL. Fuck all other languages. If you know SQL and nothing else, you can make bank. Payroll specialtist? Maybe 50k. Payroll specialist who knows SQL? 90k. Average joe with organizational skills at big corp? $40k. Average joe with organization skills AND sql? Call yourself a PM and earn $150k.

  • Tests are important but TDD is a damn cult.

  • Cushy government jobs are not what they are cracked up to be, at least for early to mid-career engineers. Sure, $120k + bennies + pension sound great, but you’ll be selling your soul to work on esoteric proprietary technology. Much respect to government workers but seriously there’s a reason why the median age for engineers at those places is 50+. Advice does not apply to government contractors.

  • Third party recruiters are leeches. However, if you find a good one, seriously develop a good relationship with them. They can help bootstrap your career. How do you know if you have a good one? If they’ve been a third party recruiter for more than 3 years, they’re probably bad. The good ones typically become recruiters are large companies.

  • Options are worthless or can make you a millionaire. They’re probably worthless unless the headcount of engineering is more than 100. Then maybe they are worth something within this decade.

  • Work from home is the tits. But lack of whiteboarding sucks.

  • I’ve never worked at FAANG so I don’t know what I’m missing. But I’ve hired (and not hired) engineers from FAANGs and they don’t know what they’re doing either.

  • My self worth is not a function of or correlated with my total compensation. Capitalism is a poor way to determine self-worth.

  • Managers have less power than you think. Way less power. If you ever thing, why doesn’t Manager XYZ fire somebody, it’s because they can’t.

  • Titles mostly don’t matter. Principal Distinguished Staff Lead Engineer from Whatever Company, whatever. What did you do and what did you accomplish. That’s all people care about.

  • Speaking of titles: early in your career, title changes up are nice. Junior to Mid. Mid to Senior. Senior to Lead. Later in your career, title changes down are nice. That way, you can get the same compensation but then get an increase when you’re promoted. In other words, early in your career (<10 years), title changes UP are good because it lets you grow your skills and responsibilities. Later, title changes down are nice because it lets you grow your salary.

  • Max out our 401ks.

  • Be kind to everyone. Not because it’ll help your career (it will), but because being kind is rewarding by itself.

  • If I didn’t learn something from the junior engineer or intern this past month, I wasn’t paying attention.

Oops I’m out of wine.

  • Paying for classes, books, conferences is worth it. I’ve done a few conferences, a few 1.5k courses, many books, and a subscription. Worth it. This way, I can better pretend what I’m doing.

  • Seriously, why aren’t webdevs paid more? They know everything!!!

  • Carpal tunnel and back problems are no joke. Spend the 1k now on good equipment.

  • The smartest man I’ve every worked for was a Math PhD. I’ve learned so much from that guy. I hope he’s doing well.

  • Once, in high school, there was thing girl who was a great friend of mine. I mean we talked and hung out and shared a lot of personal stuff over a few years. Then there was a rumor that I liked her or that we were going out or whatever. She didn’t take that too well so she started to ignore me. That didn’t feel too good. I guess this would be the modern equivalent to “ghosting”. I don’t wish her any ill will though, and I hope she’s doing great. I’m sorry I didn’t handle that better.

  • I had a girlfriend in 8th grade that I didn’t want to break up with even though I didn’t like her anymore so I just started to ignore her. That was so fucked up. I’m sorry, Lena.

  • You know what the best part of being a software engineer is? You can meet and talk to people who think like you. Not necessarily the same interests like sports and TV shows and stuff. But they think about problems the same way you think of them. That’s pretty cool.

  • There’s not enough women in technology. What a fucked up industry. That needs to change. I’ve been trying to be more encouraging and helpful to the women engineers in our org, but I don’t know what else to do.

  • Same with black engineers. What the hell?

  • I’ve never really started hating a language or technology until I started becoming intimately familiar with it. Also, I think a piece of tech is good if I hate it but I simultaneously would recommend it to a client. Fuck Jenkins but man I don’t think I would be commuting software malpractice by recommending it to a new client.

  • That being said, git is awful and I have choice but to use it. Also, GUI git tools can go to hell, give me the command line any day. There’s like 7 command lines to memorize, everything else can be googled.

  • Since I work in data, I’m going to give a data-specific lessons learned. Fuck pandas.

  • My job is easier because I have semi-technical analysts on my team. Semi-technical because they know programming but not software engineering. This is a blessing because if something doesn’t make sense to them, it means that it was probably badly designed. I love the analysts on the team; they’ve helped me grow so much more than the most brilliant engineers.

  • Dark mode is great until you’re forced to use light mode (webpage or an unsupported app). That’s why I use light mode.

  • I know enough about security to know that I don’t know shit about security.

Crap I’m out of wine.

  • Being a good engineer means knowing best practices. Being a senior engineer means knowing when to break best practices.

  • If people are trying to assign blame to a bug or outage, it’s time to move on.

  • A lot of progressive companies, especially startups, talk about bringing your “authentic self”. Well what if your authentic self is all about watching porn? Yeah, it’s healthy to keep a barrier between your work and personal life.

  • I love drinking with my co-workers during happy hour. I’d rather spend time with kids, family, or friends.

  • The best demonstration of great leadership is when my leader took the fall for a mistake that was 100% my fault. You better believe I would’ve walked over fire for her.

  • On the same token, the best leaders I’ve been privileged to work under did their best to both advocate for my opinions and also explain to me other opinions that conflict with mine. I’m working hard to be like them.

  • Fuck side projects. If you love doing them, great! Even if I had the time to do side-projects, I’m too damn busy writing drunken posts on reddit

  • Algorithms and data strictures are important — to a point. I don’t see pharmacist interviews test trivia about organic chemistry. There’s something fucked with our industry’s interview process.

  • Damn, those devops guys and gals are f’ing smart. At least those mofos get paid though.

  • It’s not important to do what I like. It’s more important to do what I don’t hate.

  • The closer I am to the product, the closer I am to driving revnue, the more I feel valued regardless of how technical my work is. This has been true for even the most progressive companies.

  • Linux is important even when I was working in all Windows. Why? Because I eventually worked in Linux. So happy for those weekend where I screwed around installing Arch.

  • I’ve learned to be wary for ambiguous buzz words like big data. WTF is “big” data? I’ve dealt with 10k rows streaming every 10 minutes in Spark and Kafka and dealt with 1B rows batched up hourly in Python and MySQL. Those labels can go fuck themselves.

  • Not all great jobs are in Silicon Valley. But a lot are.

Oh shit I found beer: let’s keeping going.

  • I once hated a programming language (C#) until I started using it. Now I hated it but think it’s useful.

  • Then I started hating a programming language (C#) and left it and came back. Wow, that programming language has really improved.

  • The greatest thing about functional languages is that functions are first class and all other programmers know that.

  • No matter how great or superior a language is, it doesn’t matter if people don’t use it.

  • Learning a language isn’t hard. It’s learning the ecosystem.

  • Pair programming is great, it just takes a lot of time — time that the company usually doesn’t want to spend.

  • Working with smart engineers has made me a better coder. Working with smart non-technical co-workers has made me a better engineer.

  • Don’t spend time outside of the 9-5 working. Unless you want to because you got a banging project and you’re in the groove. That shit is awesome.

  • Happy hours and social hours across teams are 99% just chilling and getting to know coworkers. That’s cool. Every once in a while, the 1% is about a critical project with a critical piece of code and you’re glad you brought up work in a social setting because shit would’ve hit the fan otherwise. I’m not saying that I should hang out with other teams outside of work because of this. I just want to bond. But it sure as hell is a nice perk.

  • If the company is half remote and half on-site, it’s important to determine if the remote people aren’t treated as second-class citizens. If major decisions are made “at the water cooler”, then it’s better to try to change the company culture (hard) or move on to a different company that treats its remote employees as first class citizens.

  • The second worst major downside of working from home is no whiteboard.

  • The first major downside of working from home is that it’s hard to learn from coworkers. Unless I’m (a) confident and assertive to ask questions and (b) the company has a culture where remote workers are equivelent to on-site workers, I think it was best that I worked on-side for the first 5 years of my career.

  • Everyone knows that tech changes. The tech landscape of the past 10 years has changed dramatically. But fundamentals don’t change very much, especially fundamentals that apply to my field.

  • Hacker news and r/programming is only good to get general ideas and keep up-to-date. The comments are almost worthless.

  • There’s a lot of vocal amateurs with strong opinions about technology. Even amateurs published on “respectable” journals and blogs. I found it to keep abreast of the rumors but to figure things out for myself.

  • I work at a cutting edge startup and we don’t use the latest XYZ tech that was present at ABC cutting edge tech company. And it turn out, what they usually present is only a small percentage of their engineering department and that most of them are using the same tech we are.

  • That being said, it’s important to read the signs. If you want to work with modern tech and you’re company is still doing the majority of it’s development in jQuery, might be time to re-evauluate.

  • Fuck it I’m a data engineer so I might as well give more specific, target advice/experience

  • SQL is king. Databases like MySQL, Postgres, Oracle, SQL Server, SQLite is still supreme. Even if you work with new tech, most of it transfers anyway.

  • Most companies aren’t doing streaming. It’s hard and complicated. If you’re 10 years into your career and you don’t know how to work with 10k records per second, don’t worry about it, there’s still jobs out for you.

  • Airflow is shit, yes. There are other products out there, but fuck me if Airflow isn’t the most widely used.

  • Machine learning projects are highly prone to failure. They’re complicated and hard to implement. Don’t believe me? How easy is it to write fucking unit test a machine learning model? Yeah.

  • Our field is new. There’s no good book on data engineering, just go and “do it”. Can’t learn it through a bootcamp and shit. This will probably change in 10 years as we all figure out what the fuck we’re doing.

  • People die. Do you want your code to be your legacy? If yes, then spend a lot of time on it because that’s your fucking legacy and you go! But if you are like me, your legacy is surrounded with family, friends, and people in your life and not the code you write. So don’t get too hung up on it.

  • Good people write shitty code. Smart people write shitty code. Good coders and good engineers write shitty code. Don’t let code quality be a dependent variable on your self worth.

  • I got into tech and coding because tech was my hobby. Now my hobby is is the same as work and work has ruined my hobby. So now if I want to enjoy tech I need to quit my hobby. Or I need to be OK that tech is no longer my hobby and find new hobbies.

  • Programming and computer science is like, what, 80 years old? Compare that with any other engineering discipline. Yeah, we collectively don’t know what the fuck we’re doing.

  • I’m making pretty good money. Be grateful and appreciate. Also, save.

  • I’ve built large platforms and libraries that are used by multiple teams and people for many years. Yet for some reason, the most proud I was of the code I wrote was the small script that was used by me.

  • The proudest accomplishment of my career has been helping other people be better at their jobs. That’s probably because I’m destined to be a people manager, so this is probably not helpful to other people.

  • When I was looking for a job, I created an updated my Linkedin. I got shit replies and deleted it. Now I use Linkedin to find other candidates to join my company. Bottom line, Linkedin is a lot of noise. I only find it valuable because now, part of my job is contributing to that noise.

  • Once, I found out in college that a girl liked me. I didn’t believe it because I had poor self esteem, but then she asked me out. I told her I wasn’t interested even though she was really cool. That was one of the proudest moments in my life because I as mature enough at 19 to say “no” in a mature way.

  • r/cscareerquestions is such a cesspool of ego and misinformation that I don’t know what to do about it. Like, WTF. I want to shake all those people and try to explain to them how the world really is, but they wouldn’t believe me.

  • I’m drunk and I usually don’t drink, so I would think that everything I say is probably cringy or terrible

  • I feel strongly that people should save and invest money. If you have a 6 figure salary, do your best to max our your 401k please.

  • I’ve become what I’ve always hated: someone who works in tech in a career but avoid tech in real life. Maybe that comes with being old.

  • r/ExperiencedDevs is a pretty cool community. Thank you mods. You get way less appreciation than you deserve. Seriously, thank you.

  • I probably owe my career, my salary, my life to Reddit. Reddit gets a lot of shit but the communities here have lifted me out of poverty (working at a gas station earning min wage) to learning Linux, SQL, python, C#, Python, and others to get me where I am.

  • Kids are great. I don’t have kids by choice. Why? Because I love kids and I’m scared about what kind of father I would be. Oh shit, is that too personal for a post here?

  • Once, someone asked me who I looked up to and I said Conan O’Brien, and they laughed at me. But I was being serous because on his last show on the Tonight Show, he told his audience to be kind and work hard. It happend during a difficult period of my life, and when I watched him say that, I said, you know what, I’m going to do just that. Because what would I have to lose? And you know what? I’ve met some brilliant people who I’ve learned from over 10+ years because I was kind to them. And I’ve grown a lot by working hard and not being afraid to try new things. And my life is infinitely, infinitely better because of those words. So yes, it might seem silly and even ridiculous to say that I’ve achieved a level of fulfillment in my life because of a late night talk show. But you know what, fuck it, it’s my life and I will proudly say that I owe any success I’ve achieved because a fucking comic on late night television.

I’m highly intoxicated so please disregard anything I say. Also apologies for ranting.

I saved this because it’s one of the most honest things I’ve read about our industry. As a data engineer with 10+ years in, I agree with almost all of it — especially the parts about SQL being king, tech stacks not mattering as much as you think, and the best code being no code at all. The only thing I’d push back on is the dynamic languages take. But hey, the man was drunk.

No posts

↑ top

13.Cal.diy: open-source community edition of cal.com

Sourcehttps://github.com/calcom/cal.diy

SiteGitHub

Submitterpetecooper (Hacker News)

Submitted2026-04-21 17:58 UTC (Hacker News)

HN activity163 points · 41 comments

Length4.1K words (~18 min read)

Languageen

Scheduling infrastructure for absolutely everyone. - calcom/cal.diy

Warning

Use at your own risk. Cal.diy is the open source community edition of Cal.com and it is intended for users who want to self-host their own Cal.diy instance. It is strictly recommended for personal, non-production use. Please review all installation and configuration steps carefully. Self-hosting requires advanced knowledge of server administration, database management, and securing sensitive data. Proceed only if you are comfortable with these responsibilities.

Tip

For any commercial and enterprise-ready scheduling infrastructure, use Cal.com, not Cal.diy; hosted by us or get invited to on-prem enterprise access here: https://cal.com/sales

Logo

Cal.diy

License Github Stars Commits-per-month Docker Pulls

About Cal.diy

booking-screen

Cal.diy is the community-driven, fully open-source scheduling platform — a fork of Cal.com with all enterprise/commercial code removed.

Cal.diy is 100% MIT-licensed with no proprietary "Enterprise Edition" features. It's designed for individuals and self-hosters who want full control over their scheduling infrastructure without any commercial dependencies.

What's different from Cal.com?

  • No enterprise features — Teams, Organizations, Insights, Workflows, SSO/SAML, and other EE-only features have been removed
  • No license key required — Everything works out of the box, no Cal.com account or license needed
  • 100% open source — The entire codebase is licensed under MIT, no "Open Core" split
  • Community-maintained — Contributions are welcome and go directly into this project (see CONTRIBUTING.md)

Note: Cal.diy is a self-hosted project. There is no hosted/managed version. You run it on your own infrastructure.

Built With

Getting Started

To get a local copy up and running, please follow these simple steps.

Prerequisites

Here is what you need to be able to run Cal.diy.

  • Node.js (Version: >=18.x)
  • PostgreSQL (Version: >=13.x)
  • Yarn (recommended)

If you want to enable any of the available integrations, you may want to obtain additional credentials for each one. More details on this can be found below under the integrations section.

Development

Setup

  1. Clone the repo (or fork https://github.com/calcom/cal.diy/fork)

    git clone https://github.com/calcom/cal.diy.git

    If you are on Windows, run the following command on gitbash with admin privileges:
    > git clone -c core.symlinks=true https://github.com/calcom/cal.diy.git

  2. Go to the project folder

    cd cal.diy
  3. Install packages with yarn

    yarn
  4. Set up your .env file

    • Duplicate .env.example to .env
    • Use openssl rand -base64 32 to generate a key and add it under NEXTAUTH_SECRET in the .env file.
    • Use openssl rand -base64 24 to generate a key and add it under CALENDSO_ENCRYPTION_KEY in the .env file.

Windows users: Replace the packages/prisma/.env symlink with a real copy to avoid a Prisma error (unexpected character / in variable name):

# Git Bash / WSL
rm packages/prisma/.env && cp .env packages/prisma/.env
  1. Setup Node If your Node version does not meet the project's requirements as instructed by the docs, "nvm" (Node Version Manager) allows using Node at the version required by the project:

    nvm use

    You first might need to install the specific version and then use it:

    nvm install && nvm use

    You can install nvm from here.

Quick start with yarn dx

  • Requires Docker and Docker Compose to be installed
  • Will start a local Postgres instance with a few test users - the credentials will be logged in the console
yarn dx

Default credentials created:

Email Password Role
free@example.com free Free user
pro@example.com pro Pro user
trial@example.com trial Trial user
admin@example.com ADMINadmin2022! Admin user
onboarding@example.com onboarding Onboarding incomplete

You can use any of these credentials to sign in at http://localhost:3000

Tip: To view the full list of seeded users and their details, run yarn db-studio and visit http://localhost:5555

Development tip

  1. Add export NODE_OPTIONS="--max-old-space-size=16384" to your shell script to increase the memory limit for the node process. Alternatively, you can run this in your terminal before running the app. Replace 16384 with the amount of RAM you want to allocate to the node process.

  2. Add NEXT_PUBLIC_LOGGER_LEVEL={level} to your .env file to control the logging verbosity for all tRPC queries and mutations.
    Where {level} can be one of the following:

    0 for silly
    1 for trace
    2 for debug
    3 for info
    4 for warn
    5 for error
    6 for fatal

    When you set NEXT_PUBLIC_LOGGER_LEVEL={level} in your .env file, it enables logging at that level and higher. Here's how it works:

    The logger will include all logs that are at the specified level or higher. For example: \

    • If you set NEXT_PUBLIC_LOGGER_LEVEL=2, it will log from level 2 (debug) upwards, meaning levels 2 (debug), 3 (info), 4 (warn), 5 (error), and 6 (fatal) will be logged. \
    • If you set NEXT_PUBLIC_LOGGER_LEVEL=3, it will log from level 3 (info) upwards, meaning levels 3 (info), 4 (warn), 5 (error), and 6 (fatal) will be logged, but level 2 (debug) and level 1 (trace) will be ignored. \
echo 'NEXT_PUBLIC_LOGGER_LEVEL=3' >> .env

for Logger level to be set at info, for example.

Gitpod Setup

  1. Click the button below to open this project in Gitpod.

  2. This will open a fully configured workspace in your browser with all the necessary dependencies already installed.

Open in Gitpod

Manual setup

  1. Configure environment variables in the .env file. Replace <user>, <pass>, <db-host>, and <db-port> with their applicable values

    DATABASE_URL='postgresql://<user>:<pass>@<db-host>:<db-port>'
    
    If you don't know how to configure the DATABASE_URL, then follow the steps here to create a quick local DB
    1. Download and install postgres in your local (if you don't have it already).

    2. Create your own local db by executing createDB <DB name>

    3. Now open your psql shell with the DB you created: psql -h localhost -U postgres -d <DB name>

    4. Inside the psql shell execute \conninfo. And you will get the following info. image

    5. Now extract all the info and add it to your DATABASE_URL. The url would look something like this postgresql://postgres:postgres@localhost:5432/Your-DB-Name. The port is configurable and does not have to be 5432.

    If you don't want to create a local DB. Then you can also consider using services like railway.app, Northflank or render.

  2. Copy and paste your DATABASE_URL from .env to .env.appStore.

  3. Set up the database using the Prisma schema (found in packages/prisma/schema.prisma)

    In a development environment, run:

    yarn workspace @calcom/prisma db-migrate

    In a production environment, run:

    yarn workspace @calcom/prisma db-deploy
  4. Run mailhog to view emails sent during development

    NOTE: Required when E2E_TEST_MAILHOG_ENABLED is "1"

    docker pull mailhog/mailhog
    docker run -d -p 8025:8025 -p 1025:1025 mailhog/mailhog
  5. Run (in development mode)

    yarn dev

Setting up your first user

Approach 1

  1. Open Prisma Studio to look at or modify the database content:

    yarn db-studio
  2. Click on the User model to add a new user record.

  3. Fill out the fields email, username, password, and set metadata to empty {} (remembering to encrypt your password with BCrypt) and click Save 1 Record to create your first user.

    New users are set on a TRIAL plan by default. You might want to adjust this behavior to your needs in the packages/prisma/schema.prisma file.

  4. Open a browser to http://localhost:3000 and login with your just created, first user.

Approach 2

Seed the local db by running

cd packages/prisma
yarn db-seed

The above command will populate the local db with dummy users.

E2E-Testing

Be sure to set the environment variable NEXTAUTH_URL to the correct value. If you are running locally, as the documentation within .env.example mentions, the value should be http://localhost:3000.

# In a terminal just run:
yarn test-e2e

# To open the last HTML report run:
yarn playwright show-report test-results/reports/playwright-html-report

Resolving issues

E2E test browsers not installed

Run npx playwright install to download test browsers and resolve the error below when running yarn test-e2e:

Executable doesn't exist at /Users/alice/Library/Caches/ms-playwright/chromium-1048/chrome-mac/Chromium.app/Contents/MacOS/Chromium

Upgrading from earlier versions

  1. Pull the current version:

    git pull
  2. Check if dependencies got added/updated/removed

    yarn
  3. Apply database migrations by running one of the following commands:

    In a development environment, run:

    yarn workspace @calcom/prisma db-migrate

    (This can clear your development database in some cases)

    In a production environment, run:

    yarn workspace @calcom/prisma db-deploy
  4. Check for .env variables changes

    yarn predev
  5. Start the server. In a development environment, just do:

    yarn dev

    For a production build, run for example:

    yarn build
    yarn start
  6. Enjoy the new version.

Deployment

Docker

The Docker image can be found on DockerHub at https://hub.docker.com/r/calcom/cal.diy.

Note for ARM Users: Use the {version}-arm suffix for pulling images. Example: docker pull calcom/cal.diy:v5.6.19-arm.

Requirements

Make sure you have docker & docker compose installed on the server / system. Both are installed by most docker utilities, including Docker Desktop and Rancher Desktop.

Note: docker compose without the hyphen is now the primary method of using docker-compose, per the Docker documentation.

Running Cal.diy with Docker Compose

  1. Clone the repository

    git clone --recursive https://github.com/calcom/cal.diy.git
  2. Change into the directory

    cd cal.diy
  3. Prepare your configuration: Rename .env.example to .env and then update .env

    cp .env.example .env

    Most configurations can be left as-is, but for configuration options see Important Run-time variables below.

    Required Secret Keys

    Before starting, you must generate secure values for NEXTAUTH_SECRET and CALENDSO_ENCRYPTION_KEY. Using the default secret placeholder in production is a security risk.

    Generate NEXTAUTH_SECRET (cookie encryption key):

    openssl rand -base64 32

    Generate CALENDSO_ENCRYPTION_KEY (must be 32 bytes for AES256):

    openssl rand -base64 24

    Update your .env file with these values:

    NEXTAUTH_SECRET=<your_generated_secret>
    CALENDSO_ENCRYPTION_KEY=<your_generated_key>

    Push Notifications (VAPID Keys) If you see an error like:

    Error: No key set vapidDetails.publicKey
    

    This means your environment variables for Web Push are missing. You must generate and set NEXT_PUBLIC_VAPID_PUBLIC_KEY and VAPID_PRIVATE_KEY.

    Generate them with:

    npx web-push generate-vapid-keys

    Then update your .env file:

    NEXT_PUBLIC_VAPID_PUBLIC_KEY=your_public_key_here
    VAPID_PRIVATE_KEY=your_private_key_here

    Do not commit real keys to .env.example — only placeholders.

    Update the appropriate values in your .env file, then proceed.

  4. (optional) Pre-Pull the images by running the following command:

    docker compose pull
  5. Start Cal.diy via docker compose

    To run the complete stack, which includes a local Postgres database, Cal.diy web app, and Prisma Studio:

    docker compose up -d

    To run Cal.diy web app and Prisma Studio against a remote database, ensure that DATABASE_URL is configured for an available database and run:

    docker compose up -d calcom studio

    To run only the Cal.diy web app, ensure that DATABASE_URL is configured for an available database and run:

    docker compose up -d calcom

    Note: to run in attached mode for debugging, remove -d from your desired run command.

  6. Open a browser to http://localhost:3000, or your defined NEXT_PUBLIC_WEBAPP_URL. The first time you run Cal.diy, a setup wizard will initialize. Define your first user, and you're ready to go!

    Note for first-time setup (Calendar integration): During the setup wizard, you may encounter a "Connect your Calendar" step that appears to be required. If you do not wish to connect a calendar at this time, you can skip this step by navigating directly to the dashboard at <NEXT_PUBLIC_WEBAPP_URL>/event-types. Calendar integrations can be added later from the Settings > Integrations page.

Updating Cal.diy

  1. Stop the Cal.diy stack

    docker compose down
  2. Pull the latest changes

    docker compose pull
  3. Update env vars as necessary.

  4. Re-start the Cal.diy stack

    docker compose up -d

Building from source with Docker

  1. Clone the repository

    git clone https://github.com/calcom/cal.diy.git
  2. Change into the directory

    cd cal.diy
  3. Rename .env.example to .env and then update .env

    For configuration options see Build-time variables below. Update the appropriate values in your .env file, then proceed.

  4. Build the Cal.diy docker image:

    Note: Due to application configuration requirements, an available database is currently required during the build process.

    a) If hosting elsewhere, configure the DATABASE_URL in the .env file, and skip the next step

    b) If a local or temporary database is required, start a local database via docker compose.

    docker compose up -d database
  5. Build Cal.diy via docker compose (DOCKER_BUILDKIT=0 must be provided to allow a network bridge to be used at build time. This requirement will be removed in the future)

    DOCKER_BUILDKIT=0 docker compose build calcom
  6. Start Cal.diy via docker compose

    To run the complete stack, which includes a local Postgres database, Cal.diy web app, and Prisma Studio:

    docker compose up -d

    To run Cal.diy web app and Prisma Studio against a remote database, ensure that DATABASE_URL is configured for an available database and run:

    docker compose up -d calcom studio

    To run only the Cal.diy web app, ensure that DATABASE_URL is configured for an available database and run:

    docker compose up -d calcom

    Note: to run in attached mode for debugging, remove -d from your desired run command.

  7. Open a browser to http://localhost:3000, or your defined NEXT_PUBLIC_WEBAPP_URL. The first time you run Cal.diy, a setup wizard will initialize. Define your first user, and you're ready to go!

Configuration

Important Run-time variables

These variables must also be provided at runtime

Variable Description Required Default
DATABASE_URL database url with credentials - if using a connection pooler, this setting should point there required postgresql://unicorn_user:magical_password@database:5432/calendso
NEXT_PUBLIC_WEBAPP_URL Base URL of the site. NOTE: if this value differs from the value used at build-time, there will be a slight delay during container start (to update the statically built files). optional http://localhost:3000
NEXTAUTH_URL Location of the auth server. By default, this is the Cal.diy docker instance itself. optional {NEXT_PUBLIC_WEBAPP_URL}/api/auth
NEXTAUTH_SECRET Cookie encryption key. Must match build variable. Generate with: openssl rand -base64 32 required secret
CALENDSO_ENCRYPTION_KEY Authentication encryption key (32 bytes for AES256). Must match build variable. Generate with: openssl rand -base64 24 required secret

Build-time variables

If building the image yourself, these variables must be provided at the time of the docker build, and can be provided by updating the .env file. Currently, if you require changes to these variables, you must follow the instructions to build and publish your own image.

Variable Description Required Default
DATABASE_URL database url with credentials - if using a connection pooler, this setting should point there required postgresql://unicorn_user:magical_password@database:5432/calendso
MAX_OLD_SPACE_SIZE Needed for Nodejs/NPM build options required 4096
NEXTAUTH_SECRET Cookie encryption key required secret
CALENDSO_ENCRYPTION_KEY Authentication encryption key required secret
NEXT_PUBLIC_WEBAPP_URL Base URL injected into static files optional http://localhost:3000
NEXT_PUBLIC_WEBSITE_TERMS_URL custom URL for terms and conditions website optional
NEXT_PUBLIC_WEBSITE_PRIVACY_POLICY_URL custom URL for privacy policy website optional
CALCOM_TELEMETRY_DISABLED Allow Cal.diy to collect anonymous usage data (set to 1 to disable) optional

Troubleshooting

SSL edge termination

If running behind a load balancer which handles SSL certificates, you will need to add the environmental variable NODE_TLS_REJECT_UNAUTHORIZED=0 to prevent requests from being rejected. Only do this if you know what you are doing and trust the services/load-balancers directing traffic to your service.

Failed to commit changes: Invalid 'prisma.user.create()'

Certain versions may have trouble creating a user if the field metadata is empty. Using an empty json object {} as the field value should resolve this issue. Also, the id field will autoincrement, so you may also try leaving the value of id as empty.

CLIENT_FETCH_ERROR

If you experience this error, it may be the way the default Auth callback in the server is using the WEBAPP_URL as a base url. The container does not necessarily have access to the same DNS as your local machine, and therefore needs to be configured to resolve to itself. You may be able to correct this by configuring NEXTAUTH_URL=http://localhost:3000/api/auth, to help the backend loop back to itself.

docker-calcom-1  | @calcom/web:start: [next-auth][error][CLIENT_FETCH_ERROR]
docker-calcom-1  | @calcom/web:start: https://next-auth.js.org/errors#client_fetch_error request to http://testing.localhost:3000/api/auth/session failed, reason: getaddrinfo ENOTFOUND testing.localhost {
docker-calcom-1  | @calcom/web:start:   error: {
docker-calcom-1  | @calcom/web:start:     message: 'request to http://testing.localhost:3000/api/auth/session failed, reason: getaddrinfo ENOTFOUND testing.localhost',
docker-calcom-1  | @calcom/web:start:     stack: 'FetchError: request to http://testing.localhost:3000/api/auth/session failed, reason: getaddrinfo ENOTFOUND testing.localhost\n' +
docker-calcom-1  | @calcom/web:start:       '    at ClientRequest.<anonymous> (/calcom/node_modules/next/dist/compiled/node-fetch/index.js:1:65756)\n' +
docker-calcom-1  | @calcom/web:start:       '    at ClientRequest.emit (node:events:513:28)\n' +
docker-calcom-1  | @calcom/web:start:       '    at ClientRequest.emit (node:domain:489:12)\n' +
docker-calcom-1  | @calcom/web:start:       '    at Socket.socketErrorListener (node:_http_client:494:9)\n' +
docker-calcom-1  | @calcom/web:start:       '    at Socket.emit (node:events:513:28)\n' +
docker-calcom-1  | @calcom/web:start:       '    at Socket.emit (node:domain:489:12)\n' +
docker-calcom-1  | @calcom/web:start:       '    at emitErrorNT (node:internal/streams/destroy:157:8)\n' +
docker-calcom-1  | @calcom/web:start:       '    at emitErrorCloseNT (node:internal/streams/destroy:122:3)\n' +
docker-calcom-1  | @calcom/web:start:       '    at processTicksAndRejections (node:internal/process/task_queues:83:21)',
docker-calcom-1  | @calcom/web:start:     name: 'FetchError'
docker-calcom-1  | @calcom/web:start:   },
docker-calcom-1  | @calcom/web:start:   url: 'http://testing.localhost:3000/api/auth/session',
docker-calcom-1  | @calcom/web:start:   message: 'request to http://testing.localhost:3000/api/auth/session failed, reason: getaddrinfo ENOTFOUND testing.localhost'
docker-calcom-1  | @calcom/web:start: }

Railway

Deploy on Railway

You can deploy Cal.diy on Railway. The team at Railway also have a detailed blog post on deploying on their platform.

Northflank

Deploy on Northflank

You can deploy Cal.diy on Northflank. The team at Northflank also have a detailed blog post on deploying on their platform.

Vercel

Currently Vercel Pro Plan is required to be able to Deploy this application with Vercel, due to limitations on the number of serverless functions on the free plan.

Deploy with Vercel

Render

Deploy to Render

Elestio

Deploy on Elestio

License

Cal.diy is fully open source, licensed under the MIT License.

Unlike Cal.com's "Open Core" model, Cal.diy has no commercial/enterprise code. The entire codebase is available under the same open-source license.

Enabling Content Security Policy

  • Set CSP_POLICY="non-strict" env variable, which enables Strict CSP except for unsafe-inline in style-src . If you have some custom changes in your instance, you might have to make some code change to make your instance CSP compatible. Right now it enables strict CSP only on login page and on other SSR pages it is enabled in Report only mode to detect possible issues. On, SSG pages it is still not supported.

Integrations

Obtaining the Google API Credentials

  1. Open Google API Console. If you don't have a project in your Google Cloud subscription, you'll need to create one before proceeding further. Under Dashboard pane, select Enable APIS and Services.
  2. In the search box, type calendar and select the Google Calendar API search result.
  3. Enable the selected API.
  4. Next, go to the OAuth consent screen from the side pane. Select the app type (Internal or External) and enter the basic app details on the first page.
  5. In the second page on Scopes, select Add or Remove Scopes. Search for Calendar.event and select the scope with scope value .../auth/calendar.events, .../auth/calendar.readonly and select Update.
  6. In the third page (Test Users), add the Google account(s) you'll be using. Make sure the details are correct on the last page of the wizard and your consent screen will be configured.
  7. Now select Credentials from the side pane and then select Create Credentials. Select the OAuth Client ID option.
  8. Select Web Application as the Application Type.
  9. Under Authorized redirect URI's, select Add URI and then add the URI <Cal.diy URL>/api/integrations/googlecalendar/callback and <Cal.diy URL>/api/auth/callback/google replacing Cal.diy URL with the URI at which your application runs.
  10. The key will be created and you will be redirected back to the Credentials page. Select the newly generated client ID under OAuth 2.0 Client IDs.
  11. Select Download JSON. Copy the contents of this file and paste the entire JSON string in the .env file as the value for GOOGLE_API_CREDENTIALS key.

Adding google calendar to Cal.diy App Store

After adding Google credentials, you can now Google Calendar App to the app store. You can repopulate the App store by running

cd packages/prisma
yarn seed-app-store

You will need to complete a few more steps to activate Google Calendar App. Make sure to complete section "Obtaining the Google API Credentials". After that do the following

  1. Add extra redirect URL <Cal.diy URL>/api/auth/callback/google
  2. Under 'OAuth consent screen', click "PUBLISH APP"

Obtaining Microsoft Graph Client ID and Secret

  1. Open Azure App Registration and select New registration
  2. Name your application
  3. Set Who can use this application or access this API? to Accounts in any organizational directory (Any Azure AD directory - Multitenant)
  4. Set the Web redirect URI to <Cal.diy URL>/api/integrations/office365calendar/callback replacing Cal.diy URL with the URI at which your application runs.
  5. Use Application (client) ID as the MS_GRAPH_CLIENT_ID attribute value in .env
  6. Click Certificates & secrets create a new client secret and use the value as the MS_GRAPH_CLIENT_SECRET attribute

Obtaining Zoom Client ID and Secret

  1. Open Zoom Marketplace and sign in with your Zoom account.
  2. On the upper right, click "Develop" => "Build App".
  3. Select "General App" , click "Create".
  4. Name your App.
  5. Choose "User-managed app" for "Select how the app is managed".
  6. De-select the option to publish the app on the Zoom App Marketplace, if asked.
  7. Now copy the Client ID and Client Secret to your .env file into the ZOOM_CLIENT_ID and ZOOM_CLIENT_SECRET fields.
  8. Set the "OAuth Redirect URL" under "OAuth Information" as <Cal.diy URL>/api/integrations/zoomvideo/callback replacing Cal.diy URL with the URI at which your application runs.
  9. Also add the redirect URL given above as an allow list URL and enable "Subdomain check". Make sure, it says "saved" below the form.
  10. You don't need to provide basic information about your app. Instead click on "Scopes" and then on "+ Add Scopes". On the left,
    1. click the category "Meeting" and check the scope meeting:write:meeting.
    2. click the category "User" and check the scope user:read:settings.
  11. Click "Done".
  12. You're good to go. Now you can easily add your Zoom integration in the Cal.diy settings.

Obtaining Daily API Credentials

  1. Open Daily.co and create an account.
  2. From within your dashboard, go to the developers tab.
  3. Copy your API key.
  4. Now paste the API key to your .env file into the DAILY_API_KEY field in your .env file.
  5. If you have the Daily Scale Plan set the DAILY_SCALE_PLAN variable to true in order to use features like video recording.

Obtaining Basecamp Client ID and Secret

  1. Visit the 37 Signals Integrations Dashboard and sign in.
  2. Register a new application by clicking the Register one now link.
  3. Fill in your company details.
  4. Select Basecamp 4 as the product to integrate with.
  5. Set the Redirect URL for OAuth <Cal.diy URL>/api/integrations/basecamp3/callback replacing Cal.diy URL with the URI at which your application runs.
  6. Click on done and copy the Client ID and secret into the BASECAMP3_CLIENT_ID and BASECAMP3_CLIENT_SECRET fields.
  7. Set the BASECAMP3_CLIENT_SECRET env variable to {your_domain} ({support_email}).

Obtaining HubSpot Client ID and Secret

  1. Open HubSpot Developer and sign into your account, or create a new one.
  2. From within the home of the Developer account page, go to "Manage apps".
  3. Click "Create legacy app" button top right and select public app.
  4. Fill in any information you want in the "App info" tab
  5. Go to tab "Auth"
  6. Now copy the Client ID and Client Secret to your .env file into the HUBSPOT_CLIENT_ID and HUBSPOT_CLIENT_SECRET fields.
  7. Set the Redirect URL for OAuth <Cal.diy URL>/api/integrations/hubspot/callback replacing Cal.diy URL with the URI at which your application runs.
  8. In the "Scopes" section at the bottom of the page, make sure you select "Read" and "Write" for scopes called crm.objects.contacts and crm.lists.
  9. Click the "Save" button at the bottom footer.
  10. You're good to go. Now you can see any booking in Cal.diy created as a meeting in HubSpot for your contacts.

Obtaining Webex Client ID and Secret

See Webex Readme

Obtaining ZohoCRM Client ID and Secret

  1. Open Zoho API Console and sign into your account, or create a new one.
  2. From within the API console page, go to "Applications".
  3. Click "ADD CLIENT" button top right and select "Server-based Applications".
  4. Fill in any information you want in the "Client Details" tab
  5. Go to tab "Client Secret" tab.
  6. Now copy the Client ID and Client Secret to your .env file into the ZOHOCRM_CLIENT_ID and ZOHOCRM_CLIENT_SECRET fields.
  7. Set the Redirect URL for OAuth <Cal.diy URL>/api/integrations/zohocrm/callback replacing Cal.diy URL with the URI at which your application runs.
  8. In the "Settings" section check the "Multi-DC" option if you wish to use the same OAuth credentials for all data centers.
  9. Click the "Save"/ "UPDATE" button at the bottom footer.
  10. You're good to go. Now you can easily add your ZohoCRM integration in the Cal.diy settings.

Obtaining Zoho Calendar Client ID and Secret

Follow these steps

Obtaining Zoho Bigin Client ID and Secret

Follow these steps

Obtaining Pipedrive Client ID and Secret

Follow these steps

Rate Limiting with Unkey

Cal.diy uses Unkey for rate limiting. This is an optional feature and is not required for self-hosting.

If you want to enable rate limiting:

  1. Sign up for an account at unkey.com
  2. Create a Root key with permissions for ratelimit.create_namespace and ratelimit.limit
  3. Copy the root key to your .env file into the UNKEY_ROOT_KEY field

Note: If you don't configure Unkey, Cal.diy will work normally without rate limiting enabled.

Contributing

We welcome contributions! Whether it's fixing a typo, improving documentation, or building new features, your help makes Cal.diy better.

Important: Cal.diy is a community fork. Contributions to this repo do not flow to Cal.com's production platform. See CONTRIBUTING.md for details.

  • Check out our Contributing Guide for detailed steps.
  • Join the discussion on GitHub Discussions.
  • Please follow our coding standards and commit message conventions to keep the project consistent.

Even small improvements matter — thank you for helping us grow!

Good First Issues

We have a list of help wanted that contain small features and bugs which have a relatively limited scope. This is a great place to get started, gain experience, and get familiar with our contribution process.

Contributors

Translations

Don't code but still want to contribute? Join our Discussions and help translate Cal.diy into your language.

Acknowledgements

Cal.diy is built on the foundation created by Cal.com and the many contributors to the original project. Special thanks to:

↑ top

14.Meta to start capturing employee mouse movements, keystrokes for AI training

Sourcehttps://www.reuters.com/sustainability/boards-policy-regulation/meta-start-capturing-employee-mouse-movements-keystrokes-ai-training-data-2026-04-21/

Sitereuters.com

Submitterdlx (Hacker News)

Submitted2026-04-21 17:40 UTC (Hacker News)

HN activity366 points · 314 comments

[scrape failed: http 401]

↑ top

15.Changes to GitHub Copilot individual plans

Sourcehttps://github.blog/news-insights/company-news/changes-to-github-copilot-individual-plans/

SiteThe GitHub Blog

AuthorJoe Binder

Published2026-04-20

HN activity347 points · 119 comments

Length894 words (~4 min read)

Languageen-US

We're making these changes to ensure a reliable and predictable experience for existing customers.

Today we’re making the following changes to GitHub Copilot’s Individual plans to protect the experience for existing customers: pausing new sign-ups, tightening usage limits, and adjusting model availability. We know these changes are disruptive, and we want to be clear about why we’re making them and how they will affect you.

Agentic workflows have fundamentally changed Copilot’s compute demands. Long-running, parallelized sessions now regularly consume far more resources than the original plan structure was built to support. As Copilot’s agentic capabilities have expanded rapidly, agents are doing more work, and more customers are hitting usage limits designed to maintain service reliability. Without further action, service quality degrades for everyone.

We’ve heard your frustrations about usage limits and model availability, and we need to do a better job communicating the guardrails we are adding—here’s what’s changing and why.

  1. New sign-ups for GitHub Copilot Pro, Pro+, and Student plans are paused. Pausing sign-ups allows us to serve existing customers more effectively.
  2. We are tightening usage limits for individual plans. Pro+ plans offer more than 5X the limits of Pro. Users on the Pro plan who need higher limits can upgrade to Pro+. Usage limits are now displayed in VS Code and Copilot CLI to make it easier for you to avoid hitting these limits.
  3. Opus models are no longer available in Pro plans. Opus 4.7 remains available in Pro+ plans. As we announced in our changelog, Opus 4.5 and Opus 4.6 will be removed from Pro+.

These changes are necessary to ensure we can serve existing customers with a predictable experience. If you hit unexpected limits or these changes just don’t work for you, you can cancel your Pro or Pro+ subscription and receive a refund for the time remaining on your current subscription by visiting your Billing settings before May 20..

How usage limits work in GitHub Copilot

GitHub Copilot has two usage limits today: session and weekly (7 day) limits. Both limits depend on two distinct factors—token consumption and the model’s multiplier.

The session limits exist primarily to ensure that the service is not overloaded during periods of peak usage. They’re set so most users shouldn’t be impacted. Over time, these limits will be adjusted to balance reliability and demand. If you do encounter a session limit, you must wait until the usage window resets to resume using Copilot.

Weekly limits represent a cap on the total number of tokens a user can consume during the week. We introduced weekly limits recently to control for parallelized, long-trajectory requests that often run for extended periods of time and result in prohibitively high costs.

The weekly limits for each plan are also set so that most users will not be impacted. If you hit a weekly limit and have premium requests remaining, you can continue to use Copilot with Auto model selection. Model choice will be reenabled when the weekly period resets. If you are a Pro user, you can upgrade to Pro+ to increase your weekly limits. Pro+ includes over 5X the limits of Pro.

Usage limits are separate from your premium request entitlements. Premium requests determine which models you can access and how many requests you can make. Usage limits, by contrast, are token-based guardrails that cap how many tokens you can consume within a given time window. You can have premium requests remaining and still hit a usage limit.

Avoiding surprise limits and improving our transparency

Starting today, VS Code and Copilot CLI both display your available usage when you’re approaching a limit. These changes are meant to help you avoid a surprise limit.

Screenshot of a usage limit being hit in VS Code. A message appears that says 'You've used over 75% of your weekly usage limit. Your limit resets on Apr 27 at 8:00 PM.'
Usage limits in VS Code
A screenshot of a usage limit being hit in GitHub Copilot CLI. A message appears that says '! You've used over 75% of your weekly usage limit. Your limit resets on Apr 24 at 3 PM.'
Usage limits in Copilot CLI

If you are approaching a limit, there are a few things you can do to help reduce the chances of hitting it:

  • Use a model with a smaller multiplier for simpler tasks. The larger the multiplier, the faster you will hit the limit.
  • Consider upgrading to Pro+ if you are on a Pro plan to raise your limit by over 5X.
  • Use plan mode (VS Code, Copilot CLI) to improve task efficiency. Plan mode also improves task success.
  • Reduce parallel workflows. Tools such as /fleet will result in higher token consumption and should be used sparingly if you are nearing your limits.

Why we’re doing this

We’ve seen usage intensify for all users as they realize the value of agents and subagents in tackling complex coding problems. These long-running, parallelized workflows can yield great value, but they have also challenged our infrastructure and pricing structure: it’s now common for a handful of requests to incur costs that exceed the plan price! These are our problems to solve. The actions we are taking today enable us to provide the best possible experience for existing users while we develop a more sustainable solution.

Editor’s note: Updated April 21, 2026, to clarify the refund policy.

Written by

Joe Binder

VP of Product

Related posts

Image featuring the GitHub invertocat logo displayed on a floating cube against a decorative background.

Geometric background featuring cubes with the GitHub invertocat logo and related icons.

Explore more from GitHub

Docs

Docs

Everything you need to master GitHub, all in one place.

Go to Docs

GitHub

GitHub

Build what’s next on GitHub, the place for anyone from anywhere to build anything.

Start building

Customer stories

Customer stories

Meet the companies and engineering teams that build with GitHub.

Learn more

The GitHub Podcast

The GitHub Podcast

Catch up on the GitHub podcast, a show dedicated to the topics, trends, stories and culture in and around the open source developer community on GitHub.

Listen now

↑ top

16.Edit store price tags using Flipper Zero

Sourcehttps://github.com/i12bp8/TagTinker

SiteGitHub

Submittertrueduke (Hacker News)

Submitted2026-04-19 09:26 UTC (Hacker News)

HN activity292 points · 286 comments

Length843 words (~4 min read)

Languageen

Flipper Zero app for ESL research using IR. All based on https://www.furrtek.org/?a=esl - i12bp8/TagTinker

Infrared ESL Research Toolkit for Flipper Zero
Protocol study • Signal analysis • Controlled display experiments on authorized hardware

License: GPL-3.0 Platform: Flipper Zero Status: Research Project

TagTinker demo

Owner-authorized lab display experiment


Important

TagTinker is a research tool.

It is intended only for protocol study, signal analysis, and controlled experiments on hardware you personally own or are explicitly authorized to test.

This repository does not authorize access to, modification of, or interference with any third-party deployment, commercial installation, or retail environment.

Warning

Strictly prohibited uses include:

  • Testing against deployed third-party systems
  • Use in retail or commercial environments
  • Altering prices, product data, or operational displays
  • Interfering with business operations
  • Bypassing pairing, authorization, or security controls
  • Any unauthorized, unlawful, or harmful activity

Overview

TagTinker is a Flipper Zero app for educational research into infrared electronic shelf-label protocols and related display behavior on authorized test hardware.

It is focused on:

  • protocol observation and replay analysis
  • controlled display experiments
  • monochrome image preparation workflows
  • local tooling for research and interoperability testing

This README intentionally avoids deployment-oriented instructions and excludes guidance for interacting with live commercial systems.

Features

  • Text, image, and test-pattern display experiments
  • Local web-based image preparation utility (tools/tagtinker.html)
  • Signal and response testing for authorized bench hardware
  • Small, modular codebase suitable for further research
  • Research-first project structure with clear scope boundaries

FAQ

Where is the .fap release?

The Flipper app is source-first. Build the .fap yourself from this repository with ufbt so it matches your firmware and local toolchain.

What if it crashes or behaves oddly?

The maintainer primarily uses TagTinker on Momentum firmware with asset packs disabled and has not had issues in that setup. If you are using a different firmware branch, custom asset packs, or a heavily modified device setup, start by testing from a clean baseline.

What happens if I pull the battery out of the tag?

Many infrared ESL tags store their firmware, address, and display data in volatile RAM (not flash memory) to save cost and energy.
If you remove the battery or let it fully discharge, the tag will lose all programming and become unresponsive ("dead"). It usually cannot be recovered without the original base station.

I found a bug or want to contribute — how can I get in touch?

You can contact me on:

  • Discord: @i12bp8
  • Telegram: @i12bp8

I'm currently traveling, so response times may be slower than usual. Feel free to open issues or Pull Requests anyway — contributions (bug fixes, improvements, documentation, etc.) are very welcome and will help keep the project alive while I'm away.

How It Works

TagTinker is built around the study of infrared electronic shelf-label communication used by fixed-transmitter labeling systems.

At a high level:

  • tags receive modulated infrared transmissions rather than ordinary consumer-IR commands
  • communication is based on addressed protocol frames containing command, parameter, and integrity fields
  • display updates are carried as prepared payloads for supported monochrome graphics formats
  • local tooling in this project helps researchers prepare assets and perform controlled experiments on authorized hardware

This project is intended to help researchers understand:

  • signal structure
  • frame and payload behavior
  • display data preparation constraints
  • safe, authorized bench-testing workflows

For the underlying reverse-engineering background and deeper protocol research, see:

Project Scope

TagTinker is limited to home-lab and authorized research use, including:

  • infrared protocol study
  • signal timing and frame analysis
  • controlled experiments on owned or authorized hardware
  • monochrome asset preparation for testing
  • educational diagnostics and interoperability research

It is not a retail tool, operational tool, or field-use utility.

Responsible Use

You are solely responsible for ensuring that any use of this software is lawful, authorized, and appropriate for your environment.

The maintainer does not authorize, approve, or participate in any unauthorized use of this project, and disclaims responsibility for misuse, damage, disruption, legal violations, or any consequences arising from such use.

If you do not own the hardware, or do not have explicit written permission to test it, do not use this project on it.

Any unauthorized use is outside the intended scope of this repository and is undertaken entirely at the user’s own risk.

No Affiliation

This is an independent research project.

It is not affiliated with, endorsed by, authorized by, or sponsored by any electronic shelf-label vendor, retailer, infrastructure provider, or system operator.

Any references to external research, public documentation, or reverse-engineering work are included strictly for educational and research context.

Credits

This project is a port and adaptation of the excellent public reverse-engineering work by furrtek / PrecIR and related community research.

License

Licensed under the GNU General Public License v3.0 (GPL-3.0).
See the LICENSE file for details.

Warranty Disclaimer

This software is provided “AS IS”, without warranty of any kind, express or implied.

In no event shall the authors or copyright holders be liable for any claim, damages, or other liability arising from the use of this software.

Maintainer Statement

This repository is maintained as a narrowly scoped educational research project.

The maintainer does not authorize, encourage, condone, or accept responsibility for use against third-party devices, deployed commercial systems, retail infrastructure, or any environment where the user lacks explicit permission.

Research responsibly.

↑ top

17.I'm Sick of AI Everything

Sourcehttps://news.ycombinator.com/item?id=47857461 (Hacker News text post)

Sitenews.ycombinator.com

Submitterjonthepirate (Hacker News)

Submitted2026-04-22 01:19 UTC (Hacker News)

HN activity131 points · 59 comments

A while back, I stopped using Facebook because I just couldn't take it anymore. Just totally sick of it. I'm honestly getting there with AI. At this point, I would prefer to have anything AI related just be blocked at the browser level.

↑ top

18.Global growth in solar "the largest ever observed for any source"

Sourcehttps://arstechnica.com/science/2026/04/global-growth-in-solar-the-largest-ever-observed-for-any-source/

Sitearstechnica.com

Submittertambourine_man (Hacker News)

Submitted2026-04-22 01:25 UTC (Hacker News)

HN activity26 points · 3 comments

Languageen

[no extractable content]

↑ top

19.FBI looks into dead or missing scientists tied to NASA, Blue Origin, SpaceX

Sourcehttps://fortune.com/2026/04/21/scientists-disappear-die-nasa-space-blue-origin-spacex/

SiteFortune

AuthorCatherina Gioino

Submitted2026-04-22 02:49 UTC (Hacker News)

HN activity11 points · 1 comments

Length1.3K words (~6 min read)

Languageen

Eleven scientists related to nuclear and space defense programs are missing or dead since 2022. Nearly four years later, Congress is finally looking into it.

Almost a dozen scientists related to nuclear and space defense programs tied to NASA, SpaceX, and Blue Origin are dead or missing in cases as far back as 2022, and they’ve gone largely unnoticed by authorities and the public—until now.

The House Oversight Committee formally demanded answers from four federal agencies Monday on the deaths and disappearances of at least 11 American scientists and researchers with ties to NASA, nuclear research, and classified defense programs—several of them directly connected to the space defense technologies now being commercialized by SpaceX and Blue Origin.

Committee Chairman James Comer (R-Ky.) and Rep. Eric Burlison (R-Mo.), the chair of the Subcommittee on Economic Growth, Energy Policy, and Regulatory Affairs, sent letters to FBI Director Kash Patel, Secretary of Energy Chris Wright, Secretary of Defense Pete Hegseth, and NASA Administrator Jared Isaacman, requesting staff-level briefings no later than April 27.

“If the reports are accurate, these deaths and disappearances may represent a grave threat to U.S. national security and to U.S. personnel with access to scientific secrets,” the letters read.

Later on Monday, Comer said the string of deaths was unlikely to be a coincidence. “Once you see the facts, it would suggest that something sinister could be happening and it would be a national security concern,” Comer said, adding he and Burlison were looking to “see if we can put it together and find any missing links to try to solve what’s going on here. Because it’s very unlikely that this is a coincidence. Congress is very concerned about this. Our committee is making this one of our priorities now because we view this as a national security threat.”

White House responds

The White House formally acknowledged the pattern on April 15, when press secretary Karoline Leavitt was asked directly about it at a briefing. “If true, of course, that’s definitely something I think this government and administration would deem worth looking into,” she responded.

Later that day, President Trump told reporters, “I don’t know. Hopefully, coincidence, whatever you want to call it. But some of them were very important people,” adding he would have answers within “the next week and a half.” 

“I just left a meeting on that subject, so pretty serious stuff.”

In a post on X two days later, Leavitt confirmed the administration “is actively working with all relevant agencies and the FBI to holistically review all of the cases together and identify any potential commonalities that may exist,” adding, “No stone will be unturned.” 

On Sunday, Patel confirmed the FBI is formally investigating. “We’re going to look for connections,” he told Fox News, “on whether there are connections to classified access, access to classified information, and or foreign actors.”

“If there’s any connections that lead to nefarious conduct or conspiracy, this FBI will make the appropriate arrest.”

The bureau told Fortune in a statement, “The FBI is spearheading the effort to look for connections into the missing and deceased scientists. We are working with the Department of Energy, Department of War, and with our state and local law enforcement partners to find answers.”

When asked for comment, NASA directed Fortune to its first official statement on the matter in an X post. “NASA is coordinating and cooperating with the relevant agencies in relation to the missing scientists. At this time, nothing related to NASA indicates a national security threat. The agency is committed to transparency and will provide more information as able.”

SpaceX and Blue Origin, and the scientists involved

The committee’s letters focus on NASA and nuclear research connections, but the broader context is the commercial space-defense industry that these scientists helped build. The planetary defense and nuclear research fields are notably insular: There are only a couple hundred scientists who specialize in asteroid characterization, deflection modeling, and space-based detection.

Blue Origin unveiled its NEO Hunter planetary defense concept in March 2026, developed in partnership with California’s Jet Propulsion Laboratory (JPL) and Caltech and built on its Blue Ring spacecraft platform. The ion-beam deflection and kinetic impact capabilities it proposes share core technology with missile-defense detection and interception systems. 

Both companies have received substantial federal contracts under the Trump administration. Space Force awarded SpaceX nearly $6 billion and Blue Origin approximately $2.3 billion in national security launch contracts in April 2025. SpaceX is separately under contract for the Golden Dome missile defense satellite constellation; Blue Origin has been added to the $151 billion SHIELD contract through the Missile Defense Agency and hired its first-ever president of national security in December 2025. 

NASA Administrator Isaacman, one of the four letter recipients, has championed the expansion of the privatization of missions previously managed by government agencies. Neither SpaceX nor Blue Origin responded to Fortune’s requests for comment.

The letters flag a close professional tie between two of the missing: Aerojet Rocketdyne and JPL engineer Monica Reza and retired Air Force Maj. Gen. William Neil McCasland, both of whom vanished, in 2025 and 2026 respectively. The letters note that the two worked together on “an Air Force–funded research program in the early 2000s pertaining to advanced materials needed for reusable space vehicles and weapons,” which Comer and Burlison say has not been explained.

Deaths and disappearances

The cases date back to 2022 and span JPL, Los Alamos National Laboratory, MIT, Caltech, and the Kansas City National Security Campus. Reza, 60, was director of JPL’s materials processing group and had patented a nickel super-alloy used in both space travel and weaponry when she vanished during a hike on Angeles Crest Highway in June 2025 and was never found. She patented a nickel super-alloy for rocket manufacturing, research that went into reusable rocket programs like New Glenn and Starship. McCasland, 68, disappeared from his Albuquerque home on Feb. 27 of this year, leaving on foot with only a .38 caliber revolver.

JPL principal scientist Frank Maiwald, 61, died on July 4, 2024, with no cause of death released and no statement from NASA. Government contractor Steven Garcia, who oversaw nuclear weapons assets at the Kansas City National Security Campus, disappeared from Albuquerque in August 2025, last seen on surveillance footage leaving on foot with a handgun.

Michael Hicks, who worked at JPL from 1998 to 2022, passed away in July 2023 at age 59. He worked on asteroid characterization research that was used in NASA’s Double Asteroid Redirection Test (DART) mission, and was the same methodology that Blue Origin’s NEO Hunter was modeled on and SpaceX’s Falcon 9 originally launched in 2021. Caltech astrophysicist Carl Grillmair was found shot dead on his front porch in rural Llano, Calif., earlier this year. The 67-year-old worked on NEOWISE and NEO Surveyor telescopes that are the detection backbone used by NEO Hunter. SpaceX is contracted to carry NEO Surveyor to orbit on a Falcon 9 in 2027.

Two Los Alamos National Laboratory employees, Anthony Chavez and Melissa Casias, vanished weeks apart in 2025 under nearly identical circumstances, each leaving behind their car, keys, wallet, and phone. Jason Thomas, an assistant director at Novartis with active DOD contracts, disappeared in December 2025 and was found dead in a Massachusetts lake three months later.

A former colleague of one of the deceased spoke to Newsweek, describing the concentration of deaths and disappearances within such a small, specialized field as defying ordinary probability. Joe Masiero, a lead scientist at the California Institute of Technology, told the publication: “It’s really unfortunate to see a tragedy played out over and over again.”

Former FBI official Chris Swecker recently speculated to the Daily Mail that the pattern is consistent with how “several foreign powers” operate, by “abducting, blackmailing, torturing, and even killing” scientists to gain intel.

↑ top

20.Optimizing Tail Sampling in OpenTelemetry with Retroactive Sampling

Sourcehttps://victoriametrics.com/blog/kubecon-eu-2026-sampling/index.html

SiteVictoriaMetrics

AuthorZhu Jiekun

Published2026-04-16

HN activity5 points · 0 comments

Length2.8K words (~13 min read)

Languageen

If you’ve been struggling with the high resource overhead of tail sampling, check out retroactive sampling, an approach that significantly reduces sampling overhead …

Last month, the VictoriaMetrics team gave a talk on retroactive sampling at KubeCon Europe 2026.

By writing this blog post, as a transcript of the session, we want to explain how retroactive sampling reduces outbound traffic, CPU, and memory usage in the data collection pipeline significantly compared to tail sampling in OpenTelemetry.

Benchmark Comparison (Lower is better. Details in section 3) Benchmark Comparison (Lower is better. Details in section 3)

1. Background

#

We’ll start with concepts for the beginners, but feel free to skip ahead to section 2 if you’re already familiar with these concepts - you won’t miss anything important.

1.1 Distributed Tracing

#

A Trace

The diagram above shows how a trace is visualized. The concept of distributed tracing is straightforward: you have a distributed system with dozens of microservices that call each other as they process a single request. Each microservice records its work as a span, and spans are organized into a trace by the parent-child relationships.

Traces could be expensive. One trace can contain hundreds or thousands of spans, with each span ranging from hundreds of bytes to multiple kilobytes. If your gateway serves millions of incoming requests every second, your microservices can easily generate traces at GB/s. Collecting, transporting, and processing this volume will stress your bandwidth, CPU, memory, and storage.

1.2 Sampling

#

Sampling is the most common way to reduce trace volume. Based on when sampling happens, it falls into two categories:

  • Head sampling
  • Tail sampling

You may be aware that other sampling approaches exist, but they are out of scope here:

  • Unit sampling: Ignores head decisions and exports spans within a specific unit, or service(s).
  • Reverse sampling: The child service can revise the head decision after an interesting event happens, and the new sampling decision will be propagated via response.
  • Various offline sampling approaches.

This post focuses only on tail-based sampling, but comments about other sampling approaches are welcome.

Head sampling makes decisions at the entry point to your distributed services, typically at the gateway. The gateway - or let’s call it “the root service” - decides whether to keep or drop the trace, and propagates the decision to child services alongside the request (via headers/metadata).

Head sampling is usually random. It does not change the sampling decision even if the trace contains interesting events or exceptions. It simply discards data without being aware of what will happen.

On the other hand, tail sampling better aligns with user needs. It decides after collecting all spans of a trace so that it can take the full context of the trace into account.

In this approach, spans are generated by services and exported to a centralized collector. After waiting for a specified time interval to consider the trace complete, the collector analyzes it and makes the decision. If sampled, it forwards the trace to the next stage (such as trace storage).

1.3 Resource Overhead of the Tail Sampling

#

The biggest problem with tail sampling is that it’s not free. In some cases, it could be even more expensive than collecting all the traces.

Tail sampling aggregates spans by trace_id and buffers them in memory. To buffer data for a few seconds or minutes, the collector running tail sampling must be provisioned with sufficient memory.

There are some techniques that can release memory earlier (such as making a decision as soon as the root span is received), but network latency and delivery unreliability in distributed systems prevent any approach from guaranteeing that all spans will arrive by a given event or time.

As a result, users often prefer longer buffering windows and aim to store more data within limited memory.

Beyond the memory cost, tail sampling imposes overhead on other resources, such as the CPU. In production, trace data cannot typically be handled by a single collector, which will hit its limits when scaling vertically. Multiple collector instances are therefore required. Since tail sampling needs to aggregate spans by trace_id, all spans of the same trace must be routed to the same collector. This means a load balancer is mandatory: either deployed in front of the tail sampling collectors or implemented via a daemonset agent for load balancing.

Anyway, extra routing and computation overhead are unavoidable.

Different Schema of Load Balancing

Last but not least, the network overhead.

In most scenarios, traces are forwarded across nodes. This uses the node’s bandwidth, which may be available at no extra cost.

But when it comes to cross-cluster, cross-region, and cross-cloud provider scenarios:

  • You need to pay for egress traffic.
  • You may need to pay for a cross-cloud interconnect to achieve high bandwidth and low latency.

However, the traces that are preserved and ingested after sampling may account for only 10% - or even less, such as 1% or 0.1%.

Junk Data

This means you pay the full cost for 100% of the traces, while most are discarded just minutes later.

2. The Retroactive Sampling

#

The core idea behind retroactive sampling is straightforward and can be summarized in two parts.

First, it sends only the necessary attributes to the central collector for decision-making, while buffering raw data on edge agents and retrieving it only when a trace is sampled.

By reducing unnecessary data transfer, it directly lowers:

  1. Memory usage in the central collector for buffering data.
  2. CPU time for transmitting (encoding/decoding) and routing data.
  3. Network bandwidth for transmission.

To reduce memory pressure on edge agents, we replaced the in-memory buffer with an on-disk FIFO queue, further lowering their overall memory footprint.

Now, let’s dive into more details.

2.1 Exporting and Retroacting Traces

#

If you take a close look at the attributes a span carries and compare them with the tail sampling conditions you are using, you will find that most of these attributes are irrelevant to the sampling decision.

Key Attributes

For example, attributes such as os.version, sdk.version, request.path, and cmd provide almost no value when users want to preserve the following traces via tail sampling:

  • Traces that contain errors.
  • Traces with excessive latency (5s or longer).
  • 1% of the remaining (healthy) traces.

The collector only needs trace_id, the start_time and end_time of each span, and status_code to make the decision.

The retroactive sampling approach works in the following way:

  1. The agent on each node buffers trace spans, while extracting only attributes needed for sampling decision and sending them to the collector.
  2. The collector makes the sampling decision and propagates it back to the agents.
  3. Based on the decision, the agent checks the buffered spans, drops unsampled spans, and sends the remaining sampled spans to the trace storage.

At its core, this approach makes sampling decisions using only a small amount of information, then retroactively requests the full spans for the sampled traces.

Retroactive Sampling

Specifically, the attributes sent to the collector can look like this. They are only 33 bytes long, while a full span can easily exceed 1 KB. As a result, the collector consumes far less memory buffering them compared with the traditional tail sampling approach which buffers the full span.

 +---------------------------+-----------------+-----------------+-----------------+
 |         16 bytes          |     8 bytes     |     8 bytes     |     1 byte      |
 +---------------------------+-----------------+-----------------+-----------------+
 |         trace_id          |    start_time   |     end_time    |   status_code   |
 +---------------------------+-----------------+-----------------+-----------------+

The collector in retroactive sampling operates similarly to tail sampling before the sampling decision. And once the decision is made, the collector sends the sampled trace_id back to all agents. This can be implemented in either a push-based or pull-based manner.

2.2 Optimization of Raw Data Buffering

#

A key to retroactive sampling is that raw spans, instead of being buffered by the tail sampling collector, should now be buffered on the agent and retrieved only when necessary. However, if we simply use the same in-memory data structures as tail sampling does, it only shifts memory pressure from the central collector to edge agents without reducing the overall memory footprint, which is not ideal.

What we did to further improve it is use an on-disk FIFO queue instead of an in-memory buffer.

We prefer this solution for the following reasons:

  1. The data volume processed by the agent differs from that of the central collector. Even without high read/write speed, a disk is sufficient for agent-side scenarios without any optimization.
  2. In addition, there are many optimization techniques available for on-disk data structure design, enabling it to support even high data throughput efficiently.

In our (prototype) implementation, trace data is processed as follows:

  1. Key attributes are extracted from trace spans and sent to the collector for sampling, as mentioned in 2.1.
  2. The batch of trace spans is then marshaled into binary data, stamped with the current timestamp, and written as a block to an on-disk FIFO queue.
  3. A background worker continuously consumes from this FIFO queue. It first reads the header bytes as the timestamp, in order to determine how long the blocks/spans have been in the queue.
  4. After confirming or waiting until the spans have exceeded a configured retention period (e.g., 1 minute), the worker will have already received the sampling decision for this block from the collector. It then filters out unsampled spans and forwards the sampled ones to trace storage.

We can use the diagram below to illustrate the workflow of the agent.

Agent in Retroactive Sampling Agent in Retroactive Sampling

We built the sampling server to replace the collector, as shown in the diagram above and the benchmark in section 3, yet their roles remain similar.

We implemented it ourselves since no such implementation exists in the OpenTelemetry collector. But once the idea is accepted by the community, we can use a standard OpenTelemetry collector to handle such task.

3. Benchmark Comparison

#

That’s enough theory for now.

We ran a benchmark using the OpenTelemetry Demo combined with traffic replay to verify whether the retroactive sampling is truly useful.

In this benchmark, we wanted to compare retroactive sampling, no sampling, and tail sampling. We deployed:

  • An application (load generator), an OpenTelemetry agent, and VictoriaTraces as traces backend for each scenario, responsible for span generation, forwarding trace spans from the same node, and receiving the sampled spans.
  • For no sampling (as a baseline), the agent only performs batching and exporting.
  • For tail sampling (as a comparison), we deployed a set of OpenTelemetry collectors between the agent and VictoriaTraces.
  • For retroactive sampling (as a comparison), we built and deployed a set of sampling servers between the agent and VictoriaTraces. We also built the retroactive sampling processor in each OpenTelemetry agent, to extract key attributes and buffer raw spans.

Benchmark Design

By generating a load of 15,000 to 30,000 spans/s, we observed CPU, memory usage, and outbound traffic as follows:

Comparison (Lower is better) Comparison (Lower is better)

  • Out-traffic refers to the actual traffic sent by the OpenTelemetry agent - that is, the traffic transmitted across nodes.
  • CPU and memory usage are measured for the OpenTelemetry agent, OpenTelemetry collector (if present), and sampling server (if present) only. These numbers reflect the resources consumed by the data collection and sampling pipeline.

For reference, the total disk space used in retroactive sampling is shown below.

Disk Usage Disk Usage

Through comparison, we can see that retroactive sampling reduces compressed traffic by 70%, while saving 60–70% of CPU and memory resources. Compared with tail sampling, retroactive sampling consumes only 1.7 GB of disk space, but saves 4 GB of memory.

4. Discussion

#

Every approach has its pros and cons, and retroactive sampling is no exception - it is not a silver bullet.

A drawback of retroactive sampling is that it provides little information to the collector for making sampling decisions.

What if users want to sample based on 10 attributes? Well, we can send all the required attributes to the collector, though this will consume additional memory and bandwidth. In the worst case, if users want to sample using all attributes of a span, retroactive sampling becomes a degraded version of tail sampling and loses much of its value.

+-------------+--------+------------------+---------------+---------------+----------------+
|  16 bytes   |   ...  |     128 bytes    |    64 bytes   |    8 bytes    |    64 bytes    |
+-------------+--------+------------------+---------------+---------------+----------------+
|  trace_id   |   ...  |   exception_log  |   user_agent  |  app_version  |    endpoint    |
+-------------+--------+------------------+---------------+---------------+----------------+

Are there any alternative solutions?

4.1 Variant: Local + Retroactive Sampling

#

We don’t have to send all (sampling-related) attributes to the collector if the local agent can determine that a trace should be sampled.

Sampling-related attributes and conditions can be divided into two categories:

  1. Aggregation across multiple spans is required to make a decision. Example: calculating trace duration using start_time / end_time from all spans.
  2. No aggregation required. Example: sampling based on the endpoint value.

For the first category of attributes, we have no choice - they must be sent to the central collector for decision-making.

But for the second category of attributes, the agent can make the sampling decision. All that remains is to propagate the decision (trace_id) to other agents, so they also send the corresponding spans to the trace storage.

So, returning to the question: what if users want to sample based on 10 attributes? We only need to transmit data for a small number of (category-1) attributes, plus the sampled trace_id determined by the remaining (category-2) attributes.

This means bandwidth usage remains constrained and does not necessarily increase as more sampling-related attributes or conditions are added.

From a data structure perspective, attributes like the examples above (128-byte exception_log, 64-byte user_agent) can be effectively replaced by a single 1-byte sampled flag.

+-------------+-------------------+-------------------------+-------------------------+
|   1 byte    |     16 bytes      |        8 bytes          |        8 bytes          |
+-------------+-------------------+-------------------------+-------------------------+
|   sampled   |     trace_id      |    start_time (opt)     |     end_time (opt)      |
+-------------+-------------------+-------------------------+-------------------------+

That’s enough discussion for the agent. But don’t forget that the collector. In this design, the collector should be responsible for two tasks instead of one:

  1. Performing retroactive sampling as usual.
  2. If the agent has already made a local sampling decision, the collector must merge it with the result from retroactive sampling and propagate the final decision to all agents.

4.2 Alternative: Disk-based Tail Sampling

#

As we mentioned earlier, the significant memory savings of retroactive sampling stem from using disk instead of memory in the OpenTelemetry agent. The same approach can also be applied to tail sampling. While it won’t help reduce network bandwidth, it still provides benefits.

The OpenTelemetry community already has a proposal to offload in-memory data to disk: #42326. Specifically, it uses Pebble, a key‑value store implemented in Go, as the on-disk storage.

#42326 [processor/tailsampling] Offloading trace storage to disk for scalability #42326 [processor/tailsampling] Offloading trace storage to disk for scalability

As shown in the benchmark, this approach reduces memory usage by over 80% compared to the memory-based tail sampling, but at the cost of a 5x increase in CPU utilization.

MetricIn-MemoryPebble (Disk)Relative
Peak memory (MB)3420.63638.78-81.32% (0.19x)
Avg memory (MB)2646.63471.15-82.20% (0.18x)
Avg CPU (%)12.8896.59+649.92% (7.50x)
Peak CPU (%)42.14230.67+447.39% (5.47x)

Since this is not a stable implementation, these numbers are likely to improve over iterations. We wish to include them in future comparisons with retroactive sampling.

What we can compare now are the data structures:

  • Whether using Pebble or any other on-disk key-value database, lookups by trace_id require random disk I/O. To speed up queries, data should be sorted by trace_id - this introduces extra overhead during data persistence.
  • In contrast, retroactive sampling uses an on-disk FIFO queue to reduce memory usage, while keeping the essential trace_id lookups in memory for fast access. We consume the FIFO queue to maximize sequential read speed, and compare it with the in-memory sampling decisions.

As we’ve observed in our benchmarks, the design of retroactive sampling delivers good performance.

5. Summary

#

Through our talk at KubeCon + CloudNativeCon and this blog post, we aim to share the core idea behind retroactive sampling, not just its concrete implementation. By focusing on reducing unnecessary data transmission, users can simultaneously optimize bandwidth, CPU, and memory usage.

Besides, disk-based designs are well worth exploring - for both tail sampling and retroactive sampling. We have seen many sampling solutions built on Kafka and other delayed message queues, which overlap with the idea of retroactive sampling. We believe the disk-based design holds great potential.

Speaking of implementation: the retroactive sampling setup used in our benchmark is still a prototype, but we plan to donate it as a new processor to the OpenTelemetry collector so more users can benefit.

We also plan to add the same functionality to VictoriaTraces’ own agent (vtagent), targeted for the second half of 2026 - 100% open source. Stay tuned.

6. Further Reading

#

The idea of retroactive sampling originates from the NSDI 2023 paper The Benefit of Hindsight: Tracing Edge-Cases in Distributed Systems, by Lei Zhang.

While its implementation differs from VictoriaMetrics’ prototype, the paper elaborates on extensive design details and potential trade-offs.

We highly recommend that everyone interested in this topic read it to understand the original design.


VictoriaMetrics at KubeCon #1 VictoriaMetrics at KubeCon #1

VictoriaMetrics at KubeCon #2 VictoriaMetrics at KubeCon #2

VictoriaMetrics at KubeCon #3 VictoriaMetrics at KubeCon #3

↑ top

21.Theseus, a Static Windows Emulator

Sourcehttps://neugierig.org/software/blog/2026/04/theseus.html

Siteneugierig.org

Submitterzdw (Hacker News)

Submitted2026-04-20 04:14 UTC (Hacker News)

HN activity84 points · 11 comments

Length2.9K words (~13 min read)

An new old approach to emulation.

April 19, 2026

This post is likely the end of my series on retrowin32.

I bring you: Theseus, a new Windows/x86 emulator that translates programs statically, solving a bunch of emulation problems while surely introducing new ones.

What happened to retrowin32?

I haven't been working on retrowin32, my win32 emulator, in part due to life stuff and in part because I haven't been sure where I wanted to go with it. And then someone who had contributed to it in the past posted retrotick, their own web-based Windows emulator that looks better than my years of work, and commented on HN that it took them an hour with Claude.

This is not a post about AI, both because there are too many of those already and because I'm not yet sure of my own feelings on it. But one small thing I have been thinking about is that (1) AI has been slowly but surely climbing the junior to senior engineer ladder; and (2) one of the main pieces of being a senior engineer is better understanding what you ought to be building, as distinct from how to build it.

(Is that just the Innovator's Dilemma's concept of "retreating upmarket", applied to my own utility as a human? Not even sure. I am grateful I do this work for the journey, to satisfy my own curiosity, because that means I am not existentially threatened like a business would be in this situation. As Benny Feldman says: "I cheat at the casino by secretly not having an attachment to material wealth!")

So, Mr. Senior Engineer, what ought we build? What problem are we even solving with emulators, and how do our approaches meet that? I came to a kind of unorthodox solution that I'd like to tell you about!

Emulators and JITs

The simplest CPU emulator is very similar to an interpreter. An input program, after parsing, becomes x86 instructions like:

mov eax, 3
add eax, 4
call ...  ; some Windows system API

An interpreting emulator is a big loop that steps through the instructions. It looks like:

loop {
   let instr = next_instruction();
   match instr {
      // e.g. `mov eax, 3`
      Mov => { set(argument_1(), argument_2()); }
      // e.g. `add eax, 4`
      Add => { set(argument_1(), argument_1() + argument_2()); }
      ...
  }
}

Like an interpreter, this approach is slow.

At a high level interpreters are slow because they are doing a bunch of dynamic work for each instruction. Imagine emulating a program that runs the same add instruction in a loop; the above emulator loop has all these function calls to repeatedly ask "what instruction am I running now?" and inspect the arguments, only to eventually do the same add on each iteration. x86 memory references are extra painful because they are very flexible.

Further, on x86 the add instruction not only adds the numbers but also computes six derived values, including things like the parity flag: whether the result contains an even number of 1 bits(!). A correct emulator needs to either compute all of these as well, or perform some sort of side analysis of the code to decide how to run it efficiently.

There are various fun techniques to improve emulators. But if you want to go fast what you really need is some combination of analyzing the code and generating native machine code from it — a JIT. JITs are famously hard to write! They are effectively optimizing compilers, which means all the complexity of optimization and generating machine code, but also where the runtime of the compilation itself is in the critical performance path. I liked this post's discussion of why JITs are hard which mentions there have been more than 15 attempts at a Python JIT.

Static binary translation

So suppose you want to generate efficient machine code, but you don't want to write a JIT. You know what's really good at analyzing code and generating efficient machine code from it? A compiler!

So here's the main idea. Given code like the above input x86 snippet, we can process it into source code that looks like:

regs.eax = 3;
regs.eax = add(regs.eax, 4);
windows_api();  // some native implementation of the API that was called

We then feed this code back in to an optimizing compiler to get a program native to your current architecture, x86 no longer needed.

In other words, instead of handing an .exe file directly to an emulator that might JIT code out, we instead have a sort of compiler that statically translates the .exe (via a second compiler in the middle) directly into a "native" executable.

(I write native in scare quotes because while the resulting executable is a native binary, it is a binary that is carrying around a sort of inner virtual machine representing the x86 state, like the regs struct in the above code. More on this in a bit.)

I think I came up with this basic idea on my own just by thinking hard about what I was trying to achieve, but it turns out this approach is known as static binary translation and is well studied. It has some nice properties, and also some big problems.

Decompilation

I'll go into those, but first, a minor detour about how I ended up here.

Have you heard of decompilation? These madmen (madpeople?) are manually recreating the source code to old video games, one function at a time. They take the game binary, extract the machine code of one function, then use a fancy UI (click one of the entries under "Recent activity") to iteratively tinker on reproducing the higher-level code that generates the exact same machine code. It's kind of amazing.

(To do this, they need to even run the same original compiler that was used to compile the target game. Those compilers are often Windows programs, which means implementing the above fancy UI involves running old Windows binaries on their Linux servers. This is how I first learned about them — they need a Windows emulator!)

Decompilation is not only just a weird and fascinating (and likely tedious?) human endeavor. It also highlighted something important for me: I don't so much care about having an emulator that can run any random program, I care about running a few very specific programs and I'm willing to go to even some manual lengths to help out.

In practice, if you look at a person building a Windows emulator, they end up as surgeons needing to kind of manually reach in and pump the heart of the target program themselves anyway, including debugging the target program and working around its individual bugs. It's common for emulators to even manually curate a list of programs that are known to work or fail.

An old idea

Statically translating machine code is not a new idea. Why isn't it more popular? My impression in trying to read about it is that it is often dismissed because it can't work, but at least so far it's worked well. Maybe I haven't yet encountered some impossible problem that I've so far overlooked?

(When trying to look up related work for this blog post, I saw this attempt at statically translating NES that concluded it can't be done, but then also these people seem to be succeeding at it so it's hard to say.)

I think there are two main problems, a technical one and a more cultural one.

The technical part is that the simple idea has complex details. To start with, any program that generates code at runtime (e.g. itself containing a JIT) won't work, but it's easy for me to just dismiss those programs as out of scope. There are also challenges around things like how control flow works, but those are small and interesting and I might go into them in future posts.

A common topic of research is that it's in the limit impossible to statically find all of the code that might be executed even in a program that doesn't generate code at runtime, because of dynamic control flow from vtables or jump tables. In particular, while there are techniques to find most of the code, no approach is guaranteed to work perfectly. This is where decompilation changed my view: if I'm willing to manually help out a bit on a specific program, then this problem might be fine?

The main cultural reason I think binary translation isn't more common is that it's not as convenient as a generic emulator that handles most programs already. Users aren't likely to want to run a compiler toolchain, though I have seen projects embed the compiler (e.g. LLVM) directly to avoid this.

The other cultural problem is there are legal ramifications if you intend to distribute translated programs. Every video game emulator relies on the legal fiction of "first, copy the game data from the physical copy you already own and pass that in as an input", so they get to plausibly remain non-derivative works.

But I'm not solving for users, I'm solving for my own interest. These cultural problems don't matter to me.

Benefits

Again consider the snippet above, which is adding 3 and 4. In a static translator world we parse the instruction stream ahead of time, so the compiler gets to see that we want to put a 3 in eax and not (as an interpreter would) spend runtime considering what values we are reading and writing where.

A compiler will not only generate the correct machine code for the target architecture, it even will optimize code like the above to just store the resulting value 7. And a compiler is capable of eliminating unneeded code like parity computations if you frame things right. Because the Theseus code generation happens "offline", separately from the execution of the program, I can worry less than a JIT might to about spending runtime analyzing the code to try to help.

When I started this I had thought that performance would be the whole benefit of this approach, but it turns out to be easier to develop as well because it brings in all of the other developer tools:

  • The translated instructions appear as regular code in the output program, which means the native debugger can step translated instructions, which appear as regular source code.
  • If the program crashes, the native stack trace traces back in to the (translated assembly of the) original program.
  • I haven't tried it yet, but CPU profiling ought to have the same benefit.

In retrowin32 I ended up building a whole debugger UI to help track down problems, but in Theseus I've just used my system debugger so far and it's been fine.

In retrowin32 I also spent a lot of time fiddling with the bridge between the emulator and native code. This boundary still exists in Theseus but it is so much smaller, because the translated code can directly call my native win32 system API implementation (with a bit of glue code to move data in and out of the inner machine's representation).

On MacOS retrowin32 could run under Rosetta but it meant the entire executable needed to be an x86-64 binary, which meant it required a cross-compiled SDL. A Theseus binary is native code that just calls the native SDL.

All told it is just much simpler. From the start of this idea to getting the test program I've tinkered with all this while running its first scene, including DirectX, FPU, and MMX, only took me a couple weeks.

Partial evaluation

You can think of the different approaches of interpreter to JIT to static binary as a spectrum of how much work you do ahead of time versus at runtime. Theseus take the dynamic question of "what kind of mov is this" and move it to the ahead of time compilation step, partially evaluating the generic instruction handler into a specific instruction with nailed-down arguments. (I'll link again to the excellent blog about meta-tracing C code. Read about Futamura projections for this idea taken to its extreme conclusion!)

For another example, a typical Windows emulator must parse and load the PE executable on startup, but Theseus does that at compile time and writes out just the data structures needed to execute it. The PE-parsing code isn't needed in the output.

Similarly, executable startup involves linking and loading any referenced DLLs including those from the system, but Theseus must see all the code it will run, so it does this linking ahead of time. Here's some output near a call to a Windows API, where at compile time it resolved an IAT reference (the ds:[...] address) directly to the Rust implementation I wrote:

// 004012a0 push 4070A4h
push(ctx, 0x4070a4u32);
// 004012a5 push 8
push(ctx, 0x8u32);
// 004012a7 call dword ptr ds:[4060E8h]
call(ctx, 0x4012ad, Cont(user32::CreateWindowExA_stdcall))

In some sense it's as if Theseus at compile time is partially running the system binary loader and the output source code is a snapshot of the ready state. It reminds me a bit of the problem of unpacking executables.

WebAssembly

Theseus should easily extend to running on the web under WebAssembly; most of it is just compiling the generated program with wasm as the target architecture. (I initially had this working then decided I don't need the additional complexity for now, so it isn't implemented.)

Separately, the output program from Theseus is inspired by how WebAssembly is executed. In both there is an outer host program that carries within it a "machine" with its own idea of code and memory. The code within that machine can only read/write to its own memory and must call provided hooks to bridge out to the host. Like WebAssembly, the Theseus output executable code is isolated from the data, with the nice property that no amount of unintentional/malicious memory writes can create new code.

A wasm Theseus would be a turducken of machines:

  1. the native host machine's WebAssembly implementation (e.g. the Chrome runtime), with its notion of memory, runs a
  2. WebAssembly virtual machine with the Theseus wasm blob, with its own idea about memory (e.g. where my Rust implementation of the Windows API puts allocations), and within that there is
  3. the x86 virtual machine and Windows program's notion of memory (which e.g. might say "read from the static data table at memory offset $x").

In thinking about it, it's tempting to try to blend some layers of machines here, and make the WebAssembly program's memory 1:1 with the input Windows program's idea of memory. That is, if the input program writes to some address $x, you could translate that to exactly writing to WebAssembly memory address $x. (You'd need to adjust the middle layer to hide its data structures in places the x86 program doesn't use.) I had to do something like this to make retrowin32 work under an x86 emulator. WebAssembly even would let me lay out the memory directly from the binary. I don't think this really buys you much, it would just be kind of cute.

On the topic of WebAssembly and static binary translation, check out wastrel which is static binary translation applied to the problem of executing WebAssembly. Reading about it surely gave me the seeds of this idea.

Theseus

I named this project Theseus, as in the ship.

Consider again the x86 assembly at the top of the post. What does it do? Depending on how you look at it, one correct answer is "adds three and four" or even just "computes 7". Or you could say it puts 3 in the eax register, adds 4 to the eax register, consumes some CPU clocks, and sets various CPU flags.

If I or my compiler replaces one of these interpretations with another, is it still the same program? Depending on which context you care about — my impression is that emulating systems like the NES requires getting the clocks exactly right — these details either matter or don't. In the case of Theseus I am explicitly throwing away the input program because I have replaced all its parts, one by one.

I have one farther off idea, again along the lines of the ship of Theseus. Implementing the Windows API is an endless stream of working around four decades of Hyrum's Law. Consider that random bug workaround again: if you were documenting the API of DirectPlayEnumerateA would you write that it calls the callback, or would it be more correct to say that it calls the callback and also restores a preserved stack pointer? If you look at the code of a Windows emulator like Wine today it is full of things like this.

One idea I've been thinking about is that for problems like these, rather than making the emulator more complicated, you could take a page from the decompilation playbook and provide an easy way to manage replacing parts of the program itself.

Once you're willing to replace pieces of a program there are more interesting possibilities. If a program has some bit of code that doesn't perform well, instead of making a JIT fancier, you could just manually replace the code with your own implementation. (It's plausible you wouldn't even need to change algorithms, it might be enough to just write the same algorithm in native code and let your modern compiler apply its autovectorization logic to it.) With enough machinery, you could even replace parts to add features, as one contributor to retrowin32 investigated here and even implemented for some GameBoy games.

↑ top

22.Running a Minecraft Server and More on a 1960s Univac Computer

Sourcehttps://farlow.dev/2026/04/17/running-a-minecraft-server-and-more-on-a-1960s-univac-computer

Sitefarlow.dev

AuthorNathan Farlow

Published2026-04-17

HN activity202 points · 33 comments

Length6.1K words (~27 min read)

Languageen

18 bit registers, 90kb of memory, ones’ complement, powered by RISC-V.

Check it out! Here I am running a Minecraft server on a 1960s UNIVAC 1219B computer:

Nathan standing next to the UNIVAC 1219B with a laptop running Minecraft.

Here’s a NES emulator rendering the first frame of Pinball:

An ASCII rendering of the NES Pinball title frame on teletype paper.

… and a selfie printed using the “overstrike” technique:

An ASCII portrait of Nathan printed on the teletype.

We ran a ton more crazy stuff, including:

  • OCaml programs (!)
  • A webserver
  • Curve25519 + AES encryption
  • A BASIC interpreter
  • ELIZA
  • Games like Oregon Trail, Wordle, and Battleship

… and so much more! All this on a 250khz computer with only 90kb RAM from the 1960s. I live for this kind of stuff! I’m obsessed with running code in weird places and smashing technical limitations. This project is my most ambitious project so far, taking about 8 months of work from myself and others.

The source for the project is here. Also see TheScienceElf’s video on this project!


The UNIVAC is a weird machine

The UNIVAC 1219B is a super weird machine and is hostile to modern programming in almost every way:

  • 18 bit words. Memory addresses and values are 18 bits! Not even a power of two.
  • Ones’ complement arithmetic, kinda. Modern computers use two’s complement to represent signed integers. This computer uses ones’ complement, but with annoying differences around signed zero that we had to reverse engineer.
  • Just a few registers. One 36 bit register A can be individually addressed by AU:AL. You get that and another 18 bit B register.
  • Only 40,960 words of memory. That’s only 90kb total memory to split between our code and the memory it needs at runtime.
  • Banked memory. These 40,960 words of memory are split into 10 banks. You have to configure which bank your instructions address in advance.

The computer’s original purpose was to be used by the Navy to read in radar signals and direct artillery. It really is an amazing feat of engineering. The computer is shown on the left in the image below. To its right is the (currently semi-functional) magnetic tape unit.

The UNIVAC 1219B and its tape drive at the Vintage Computer Federation museum.

Nearby is the teletype, which is how we interface with the computer. You can type to the UNIVAC and it can type back; everything is printed to the same sheet of paper. It’s the stdin and stdout.

A Model 35 Teletype with its dust cover, paper spool, and keyboard.

Only two UNIVAC 1219s exist today, both rescued from Johns Hopkins University by folks from the Vintage Computer Federation. This is the only one that is operational.

Before we started this project, all the programs that existed were hand-written in UNIVAC assembly. We’re going to change that by getting C compiling!


The first encounter at VCF East 2025

The first time I came across the computer was during a trip to VCF East in April 2025. Bill and Steven were running demo programs on the machine. Duane, Bill, and Steven had done a ton of amazing work to rescue and restore this computer over the last 10 years.

Seeing this thing in person was genuinely inspiring: the flashing lights, the tacking of the teletype, the smell of the oil… I knew then that I needed to get some crazy code running on this thing. Something much more than fizzbuzz. I wanted a NES emulator. I wanted OCaml. How far could we push this hardware?


We need an emulator and assembler

The first things we need are an assembler for the UNIVAC assembly language and an emulator to run that assembled program. Luckily for us, Duane had written an assembler for UNIVAC assembly in BASIC (!) and an emulator in VB.NET many years ago.

Soon after VCF was over, TheScienceElf took a stab at writing a new assembler and emulator in Rust by consulting the scans of the incredible manuals and using Duane’s implementations as a reference.

The Rust emu was fast. It was 400x faster than the real UNIVAC hardware and 40,000x faster than the VB.NET emulator. This speed turned out to be entirely necessary to power the fuzz testing I’ll discuss later.

Both emulators weren’t hardware accurate at this point, but it was good enough to start!


Wee as a first attempt at a C compiler

Now that we have an emulator, how can we get C code running in it?

The fastest way to prove out a C compiler was to use wee, an old project of mine. It’s a tiny instruction set I’ve used previously to compile C to weird places.

It worked, but holy moly it was bad. A trivial fizzbuzz program took up ~27k words, or about 67% of the total memory of the computer. It took a full minute to compute the first 100 fizzbuzz lines. Since my goal was to get real and complex programs running, this was clearly not viable.


A RISC-V emulator is the move

We have to do something smarter than wee. There are many options, so let me clarify my main two goals:

  1. I want to run real, big, interesting programs. I want to compile straight from github and let it rip on the machine. It’s less important that these real programs run maximally fast.
  2. I must maintain my sanity.

We need to use a real compiler, like LLVM or GCC

I need all of the following to accomplish the goal of running real programs:

  • Full C standard library. In this case I used picolibc.
  • Soft float and other legalizations. I need all the types and operations to work. Floats, doubles, int32, int64, everything. Even though the UNIVAC doesn’t have hardware to do this natively.
  • Dead code elimination + size optimization. We need to pack things tightly into 90kb of space.
  • Other languages. I want to support more than C, like Rust, C++, Zig, etc.

Directly compiling to the UNIVAC won’t cut it

Writing an LLVM or GCC backend for the UNIVAC would be absolutely nightmarish and would violate my second goal to maintain my sanity. The ones’ complement arithmetic, 18-bit words, and banked memory would all be painful to hack into modern compilers.

And even if we did, to actually benefit from direct compilation, your C ints would be 18-bit ones’ complement ints. That’s technically allowed by the C spec (at least until C23 mandated two’s complement), but in practice, real code often assumes >=32-bit two’s complement, so off-the-shelf programs would break.

So emulate a target GCC already supports, like RISC-V

The idea is to use GCC to compile C to RISC-V, and then emulate that RISC-V on the UNIVAC by writing a RISC-V emulator in UNIVAC assembly.

Think about how nice this is:

  • One and done. Write the emulator once and never look at UNIVAC assembly again.
  • You can fuzz it. You can have high confidence that the emulator is correct by generating random RISC-V programs, running them through the emulator and a reference emulator, and comparing the final state of the registers.
  • Incremental dopamine. I read a blog post many years ago that stuck with me about structuring projects in a way that gives incremental dopamine throughout the implementation. If you try to write the whole project and only test things at the end, you may burn out before you’re positively rewarded by seeing something work. The base RISC-V instruction set has only 38 instructions we care about, which means there’s a clear end goal. We can check them off as we implement them and they pass the fuzz tests.
  • Dense binaries. We can encode a RISC-V instruction efficiently into 2 18-bit UNIVAC words to efficiently pack them into our limited memory. This also reserves us the option in the future to implement the compressed extension or add additional bespoke compression methods.

Emulation is slower, but that’s fine

The real downside of this approach is the runtime penalty to decode and emulate each instruction. After all the optimizations, it takes ~40 UNIVAC instructions to emulate 1 RISC-V instruction. That means that our 250khz UNIVAC computer can run a ~6khz RISC-V computer.

… and that’s pretty good! The real obstacle to running real, complex programs is that 40kw of memory. This emulation gives us the best space efficiency along with its other benefits.


Building the toolchain

Here’s the high level flow of the toolchain:

  1. Write C.
  2. Compile to RISC-V with GCC.
  3. Re-encode each instruction into a UNIVAC-efficient format, 2 words per RISC-V instruction.
  4. Append these re-encoded instructions to the emulator’s source.
  5. Assemble the program into a .76 tape file to be loaded onto the machine.

Writing ~1000 lines of UNIVAC assembly for the RISC-V emulator isn’t going to be easy; you have to have good tooling before doing this. Before I ever started writing this program, I spent a couple weeks preparing:

  1. An emacs major mode.
  2. OCaml tooling for parsing, emulating, and re-encoding RISC-V, with round-trip fuzzing.
  3. Differential fuzzer that checked my UNIVAC RISC-V emulator against a ground truth (mini-rv32ima).
  4. Efficient test case reducer (using a port of Lithium).

And oh boy this investment paid dividends.

Claude Code can’t write UNIVAC assembly yet

Claude Code is great – it wrote the entire emacs major mode for me given the instruction docs. I use it frequently for code editing tasks as I write OCaml. To my dismay though, even with the docs, emulator, and differential fuzzer, Claude Code fell on its face when writing UNIVAC assembly. I can’t really blame it. UNIVAC assembly is just really weird.

No matter what I did, at this point of the project, Claude Code could not internalize the UNIVAC’s idiosyncrasies, like its ones’ complement arithmetic, the fact that left shift is circular and right shift is arithmetic, and the weird instruction special cases, like CPAL behaving differently with 0.

I can write UNIVAC assembly, though

There are moments in all programmers’ lives where you have to just lock in and grind it out. So I rolled up my sleeves, and in a matter of a few days, I typed the ~1000 lines of UNIVAC assembly to implement the 38 RISC-V instructions we needed from the base set. It was honestly an enjoyable experience!

A UNIVAC assembly file open in emacs with syntax highlighting.

The emacs major mode enables syntax highlighting and provides help text that shows the timing of the instruction.

The fuzz testing caught bugs and reduced them to a minimal repro instantly. Once the fuzzer passed for an instruction, I happily moved on; I didn’t care about efficiency at this point, just correctness.

The first C program works!

Once all the fuzz tests were passing, I ran my first C program. It…. almost worked! There was a small bug in how RISC-V memory addresses translated to UNIVAC memory addresses. I updated my fuzzer so that it would catch the bug, fixed it, and all the C programs just worked from that point on! I thanked my past self profusely for writing the fuzzer.

This was an amazing moment. Fizzbuzz worked. A BASIC interpreter worked. Even smolnes, a NES emulator, was working!

…the only catch is that it would take 20 hours to render the first frame of Pinball on the real computer (3 minutes in the emulator). We don’t have 20 hours to wait at the museum unfortunately, so is the NES idea doomed?

Not even close; we just have to optimize the hell out of this thing.


Now make it 30x faster

Our UNIVAC emulator keeps track of the total time it would take to run the programs on the real machine. This gives us a number to optimize against.

There were two numbers I focused on optimizing:

  • The runtime of all fuzzed programs, which gives a good average metric across all instructions
  • The NES demo, a representative benchmark I actually cared about making as fast as possible

Move work from runtime to encode time

The most important optimization of all is to re-encode the RISC-V instructions into a format that’s maximally efficient for the UNIVAC. A RISC-V instruction is 32 bits. Our re-encoding takes this 32 bit instruction, does some transformation, and writes the result into two 18 bit words for the UNIVAC emulator to use.

I was blown away when I read the RISC-V spec and learned how it encodes immediates: the bits are scrambled within the instruction!

The RISC-V JAL instruction encoding diagram from the official spec.

...huh? (source)

You need to spend a ton of cycles bit shifting and masking in order to reconstruct the immediate in your software emulator. Apparently this is convenient and efficient for hardware implementations? We can’t spare those cycles though, so the obvious idea is to unscramble the bits ahead of time and write them down in the right order in the re-encoding we give to the UNIVAC emu.

It’s the same story for the opcode. Deciding on how to emulate a RISC-V instruction can sometimes require you to check various non-contiguous bits in the instruction. Our encoding just assigns a convenient opcode number to each instruction.

Beyond unscrambling immediates, if there is anything that an instruction handler does immediately, bake that into the instruction directly. For example, some handlers need to immediately compute immediate * 2. May as well just store immediate * 2 instead of immediate.

The most extreme version of this are the SRLI and SRAI instructions. On the UNIVAC, we can’t shift by a variable amount. The solution is to dynamically create a shift instruction at runtime in a self-modifying-code-like way, and then execute it. But the work of creating said UNIVAC instruction can actually be done ahead of time! For SRLI/SRAI, we straight up package a UNIVAC instruction directly in the payload to later be extracted, written to RAM, and executed.

These transformations technically mean that we lose the ability to support RISC-V programs that depend on self-modifying code. But that’s a fine tradeoff for this massive speed gain.

Make the hot path faster

Classic optimization ideas still apply on the UNIVAC:

Delete dead code. A clever thing I did here was repurpose my test case minimizer to delete as many UNIVAC instructions as possible from the emulator such that the fuzz tests continued to pass. That found code I could just delete!

Jump tables. The most efficient instruction dispatch method turned out to be jump tables based on the opcode.

Instruction reordering and register liveness. The fewer times you have to store and reload registers to/from memory, the better.

Inline code. Subroutine calls have jump + return overhead; inline small functions to skip that.

Add an OCaml macro system to manage inlining

Inlining code buys you speed but will become unmaintainable if you don’t have a macro system to save you from copy + pasting code all over the place. I wrote a simple OCaml macro system: any OCaml you write between triple backticks can inject contents directly into the file. How fun 🐪

Here’s an example of reducing code duplication:

An OCaml helper function defined at the top of an asm file and called from two instruction handlers below.

And here’s an example where I use OCaml to generate a lookup table with 32 entries:

A short OCaml expression in an asm file that generates a 32-entry data table.

Add some fast syscalls, use good compiler flags

Most of these C programs have global variables we need to set to 0 at startup in the .bss section. That takes time, so I add a memclear syscall that will do this quickly in UNIVAC assembly to optimize startup time.

I also added a .noinit linker annotation to opt some big global buffers out of .bss initialization that didn’t really need it.

On the compiler flag side, -O3 does help speed things up, but not drastically compared to -Os. The UNIVAC lacks fancy hardware like caches, branch predictors, and the like for compilers to take advantage of.

Claude Code micro-optimizes massively in parallel

Having both a comprehensive fuzzer and a numeric metric to optimize against is a perfect environment for LLMs to do great work on a project.

There was a ton of low hanging fruit in my initial implementation around instruction reordering, dead code, etc. I had a Claude Code workflow that spawned 10 subagents in parallel, each in its own worktree, to independently explore and test different optimization ideas.

A terminal showing 10 Claude Code agents running in parallel in separate worktrees.

10 Claude Code subagents trying to optimize the emulator in parallel.

The main agent would merge them together assuming they met some criteria I wrote about maintainability/quality. (Don’t just inline everything, pretty please). I’d look at the final result and weigh the complexity-maintainability tradeoff before merging.

This worked well! After many iterations, I got a ~20% total speedup from this method alone.

I had to strengthen my fuzzer a couple times when the LLM would break something and the fuzzer didn’t catch it. I’d like to propose Murphy’s law of vibe-optimizing:

When LLMs optimize a program, in the limit, if any part of the system is not codified by tests, there will be a bug introduced there.

Claude Code writes the multiplication handler in Python

Another way we could get big speedup on some C programs is to implement the multiply instruction in our emulator. The base RISC-V instruction set doesn’t have multiply; the compiler can work around it by emitting adds and shifts.

I set Claude Code on the job, but this is a big ask. We need to emulate two’s complement 32 bit multiplication with weird 18 bit ones’ complement operations. Even with fuzz testing, the ability to trace the program execution, docs, 1000+ lines of high quality example asm, and many parallel attempts, Claude Code still failed.

That’s when I had the following idea: for each of the UNIVAC arithmetic instructions, implement them as Python functions. Then, ask Claude Code to write a Python program that emulates 32 bit multiplication with these functions. I’ll give it some fuzz tests, too.

The motivation here is that:

  • Claude Code is more familiar with Python
  • It can write nested expressions rather than simple asm statements
  • It can assign results to variables and write helper functions
  • It can use standard Python debugging techniques

Sure enough, with enough parallelism and time, it was able to write this Python script!

I then prompted the simpler task: translate the Python program to UNIVAC assembly. And it worked!

The multiply handler is 676 lines of inscrutable UNIVAC assembly, making up ~43% of the entire emulator. It’s a gross monstrosity, but it offers a 6x speedup for multiplication-heavy programs like primality checking and elliptic curve crypto, so it stays for now.

30x speedup

All in, NES frame time dropped from ~20 hours to ~40 minutes (30x speedup!). This was finally short enough that we could run it at the museum over lunch.


It was about time TheScienceElf and I reached out to Duane, Bill, and Steven to tell them what we had done. We hadn’t really talked to them since our visit, and since I had already sunk so much time into this project, I suddenly worried what I’d do if the computer had broken since the last time we talked.

I sent the email off and announced our UNIVAC 1219 Rust emulator, the C toolchain, and the fact that we could run real programs. So, can we visit the museum and try it out?

Everyone loved it! We made a plan to visit the museum in January.

In the weeks leading up to our trip, Duane was a massive help on technical questions given his 25+ years of UNIVAC experience. He answered questions about the computer’s ones’ complement edge cases, the IO channel setup, TTY character encoding, the bootstrap loading process, and much more. Thank you Duane!


Museum Visit #1: Hardware debugging and loading code

The day finally came. TheScienceElf, Steven, Bill, and I rolled up to the museum on a January morning. Duane was on call remotely. We booted up the UNIVAC, but there was trouble. The WAIT light came on.

The UNIVAC indicator panels with one lamp lit on the channel 4 row.

WAIT light is on due to spurious activity on channel 4.

The computer refuses to execute any instructions when the WAIT light is on. Apparently this has been a known issue for a while; the strategy in the past was to wait until the machine warms up for it to go away. After we waited 30 minutes and the light was still on, we were giving up hope. We gave Duane a call for help. Bill, Duane, and Steven traced the circuits in the manual and decided to disconnect IO channel 4 altogether. That worked! No more interrupt light! We think channel 4 had some bad hardware that was causing spurious activity and therefore interrupts.

Now for the fun part: we need to figure out how to load our programs. The usual way this works is to:

  1. Manually push buttons and levers on the front panel to program in ~30 instructions into the computer memory. This is the paper tape bootstrap program, capable of loading a program from the paper tape reader.
  2. Next, load the LECPAC roll of tape into the tape reader. LECPAC is a utility program that has useful debugging and program loading features.
  3. Push some buttons and flip some levers to configure LECPAC to read from channel 7, the serial IO channel. Duane did amazing work to develop a Teensy project that converts the UNIVAC’s parallel IO interface to serial so that we could connect our computers and send/receive data.
  4. Run the LECPAC loading routine to read our program in from serial!

A Teensy-based RS-232 to parallel adapter.

Duane's UNIVAC IO <-> serial adapter. A Teensy gives us a regular serial port so we can talk to the UNIVAC from our laptops.

But we were having trouble with step 4: we were just loading garbage data. We tried every permutation of USB cable, serial cable, and laptop we had. Nothing was getting through.

Duane emailed us a small program, only 8 instructions, to debug the serial input. We keyed it in by hand using the front panel. The program would wait for a character on the serial channel and display the result in the accumulator, whose value would then be shown in the lights on the front panel.

We used this program to experiment with different serial configurations until we sent the letter “A” and saw the correct value appear in AL. And we found the serial configuration we needed!

We loaded “Hunt the Wumpus”, a known good program written by Duane, to test the loading process over serial with our laptop. It worked! But when we tried to load our own programs from our toolchain, they failed to load. Why??

We diffed our tape files against Wumpus and realized we needed to pad the beginning of our tape file with zeros… for some reason. With that fix, our programs loaded into memory successfully!

Now for the moment of truth. We set the PC register to the start address of our C “hello world” program, hit the run switch, and…. nothing. The program was stuck for some reason that we didn’t understand. We loaded up another of our programs, a program to compute pi, and started it. Instead of printing pi, it printed a random sequence of garbage:

Teletype paper showing a line of random ASCII characters instead of the digits of pi.

Definitely not pi.

We used the front levers to step through about 20 instructions and compared against our emulator trace. It was looking good, but after spending all day on the hardware and loader, we ran out of time to find the divergence. We used LECPAC to take some core dumps for offline analysis and called it a day. (A real core dump! This thing actually uses core memory!)

What a great success though! We fixed a hardware issue and figured out how to load our programs. The next time we come back, it will be all software debugging, and that’s what I’m best at.


Fuzzing and tracing to get the emulator matching the hardware

We scheduled another trip for a month out. How can we prepare in the meantime? If the computer is just spitting garbage at you, what do you do?

We need to gain confidence that our Rust emulator matches the hardware. This is when I wrote some of my favorite programs of all:

A fuzzing program generates instruction “fingerprints”

I wrote a diagnostic program in UNIVAC assembly that takes each arithmetic instruction (ADDAL, ADDA, SUBAL, SUBA, etc.), runs it hundreds of times with pseudorandom inputs, accumulates the results into a hash, and prints the hash to the teletype. The hash is a fingerprint for the instruction’s behavior. If you run the same program on two different implementations, matching hashes mean the implementations agree. Different hashes mean there’s a divergence somewhere.

The output is one opcode per line, each followed by its octal hash:

ADDAL: 614424 223254
ADDA: 020656 635560
ADDAB: 401323 107167
SUBAL: 633336 720540
SUBA: 235365 124723
...

That’s all well and great, but when the fingerprint differs, what do you do? Why did it differ? And on what inputs? You can’t know. That’s where the software tracer comes in:

A tracer to run UNIVAC instructions one at a time

This is the wildest program that I wrote. It’s a software tracer, written in UNIVAC assembly, that runs another UNIVAC program instruction by instruction, printing the full machine state (PC, instruction, AU, AL, B, SR, ICR) between every step to the serial port. The idea is that we can diff this printout with our emulated trace and identify exactly when and why the trace differed.

Exactly how to write this software tracer is a mind-bending challenge. In short, the tracer maintains its own PC pointing into the target program. For each step, it copies the current instruction from the target into its own memory. It saves the full machine state, executes the copied instruction, then saves the state again and prints the result. Some instructions, like jumps, have to be modified to point to the tracer’s handlers, but the CPU still evaluates the jump condition itself, so the tracer doesn’t reimplement conditional logic.

Here’s the tracer running over the first few instructions of an example program. Each row is the machine state captured before that instruction executes:

PC     INSN   AU     AL     B      SR     ICR
050000 340007 000000 000000 000000 000000 000000
050007 507300 000000 000000 000000 000000 000000
050010 507200 000000 000000 000000 000000 000000
050011 701234 000000 000000 000000 000000 000000
050012 100001 000000 001234 000000 000000 000000
050013 440003 123456 001234 000000 000000 000000
050014 460003 123456 001234 000000 000000 000000
050015 120001 123456 001234 000000 000000 000000
050016 140006 123456 123456 000000 000000 000000
050017 507200 123456 123555 000000 000000 000000
050020 360144 123456 123555 000000 000000 000000
050021 420003 123456 123555 000144 000000 000000
050022 507203 123456 123555 000144 000000 000000
050023 360310 123456 123555 000141 000000 000003

There’s actually nothing stopping us from making this an interactive program and hooking GDB up to the real hardware this way. It would be totally doable to set breakpoints, inspect memory, modify registers, single-step, etc.


Museum Visit #2: The first working programs

A month after our first visit, equipped with some legendary debugging programs, we made our way back to the museum. We need to start by proofing out the most basic primitives. Can we even print text to the teletype correctly?

We started with a handwritten “HI” program in UNIVAC assembly. It worked on the first try! Now it was time to run our instruction fingerprinting program. The fingerprints came streaming out, and sure enough, there was a difference from our emulator! The four 36-bit add/sub instructions were printing different fingerprints.

Teletype output listing one opcode per line, each followed by an octal hash.

The fingerprinting program reports hashes for each instruction.

I sicced Claude Code on the hardware fingerprints and let it brute force various interpretations of the manual until we had something that matched.

After we fixed this emulator difference, we ran the asm pi program in the emu. And it printed the same garbage that we saw on the hardware!!! This means that our emulator is probably accurate now. I have never been so happy to see garbage!

Teletype paper above a laptop terminal, both showing the same garbage output from the pi program.

At this point we fixed the pi program and RISC-V emulator to work with the new interpretation of the 36 bit ops.

…and just like that, all of our programs worked. Hello world, fizzbuzz, Oregon Trail, BASIC, Figlet, ELIZA. A sudoku solver compiled from OCaml using C_of_ocaml. AES encryption. Baseball. Blackjack. Enigma encrypter and cracker. Wordle. All working! No need for the software tracer, even!

Teletype paper showing HELLO WORLD followed by fizzbuzz output.

Hello world and fizzbuzz were the first C programs to work on the UNIVAC.

Teletype paper showing an ELIZA conversation about being sad that the snow hasn't melted.

An ELIZA session. Come come, elucidate your thoughts.

A BASIC prime sieve listing and its output on the teletype.

Interactive BASIC interpreter running a prime sieve program.

We started the NES emulator over lunch. We came back thrilled to see that it printed the first visible frame!

A teletype printout of an NES Pinball frame held next to a laptop showing the same frame.

We also seized this opportunity to dump the full ASCII table to the teletype to learn its character set:

An ASCII table printed on the teletype with decimal, octal, and glyph columns.

This trip was so successful that we had some time to try out my most ambitious goal of the whole project: can we host a Minecraft server? I brought a PoC that I knew worked in the emulator.

A workbench with the UNIVAC teletype on the left, a Raspberry Pi in the middle, and a Mac laptop on the right.

The network setup: a raspberry pi runs the pppd bridge between Mac and UNIVAC serial.

We got as far as a PPP and TCP handshake happening, but didn’t get data through end to end.


Networking on the UNIVAC

My initial dream was to get a NES emulator working on the UNIVAC. But ever since we had accomplished that, I set my sights higher to try and host a Minecraft server on the computer. This is my most cursed idea yet, very technically hard, and it requires all the tools and knowledge we have spent the last many months building.

It’s important to me that we don’t cheat anything, so let’s lay out our goals:

  1. For our PoC, I only care that our Minecraft client can login. So we only need to implement the Minecraft login protocol.
  2. All interesting logic must happen on UNIVAC. No cheating.

The approach is to forward IP packets to the UNIVAC via PPP, and the UNIVAC itself implements all the PPP/IP/TCP/Minecraft protocols. In my setup, my Mac laptop connects to a port on the pi which simply forwards IP packets via pppd over serial to the UNIVAC. I’m pretty sure the Mac itself can directly run pppd, but I’m most comfortable with Linux, so I had the pi as an intermediary.

But how is it possible for the UNIVAC to run all these protocols? I’m not even sure 90kb of memory is enough to store the code of a full TCP implementation, let alone run one.

Here’s the key idea: throw all error handling out of TCP. Assume that only one connection happens at a time, all packets arrive in full and in order, and suddenly TCP is extremely simple! As long as you turn TCP into UDP, you can run it on the UNIVAC.

The Minecraft login implementation is derived from bareiron. With all these pieces together, you should be able to log into a world without blocks and fall to your death before disconnecting.

So why didn’t it work in the previous visit? I hypothesized that the issue was that the UNIVAC was dropping incoming packets on the floor as it was writing its packets out. This would actually not be a problem if we had correctly implemented all the TCP error handling, but we didn’t, so it’s critical that we don’t let this happen.

Fixing this means that we have to get our hands dirty and understand the concurrent IO features of the UNIVAC. The UNIVAC’s IO interface is roughly DMA: the hardware writes the incoming bytes into the buffer in memory you point it to. The IO interface has a mode called “Continuous Data Mode”, or “CDM”. We can configure CDM to restart the DMA at the start of the buffer once the buffer is full.

This gives us a ringbuffer primitive. We can separately track the last byte that we read from our program, and so long as we don’t fall behind more than our 4kb buffer size, we won’t drop bytes on the floor even if we’re busy processing or sending data on another channel.


Overstrike selfie art on the TTY

In the downtime before we went back to the museum, TheScienceElf was working on improving the accuracy of the emulated TTY. He sent me a screenshot correctly showing the TTY typing over the same character at the end of the line, just like what we saw at the museum when we forgot to put newlines in our output:

The emulated TTY printing pi digits and overwriting itself when the line wraps.

I was with my partner at the time and we had the idea that if we could type over the same character many times, we could achieve higher resolution ascii art. More variables to control = higher resolution. (Unfortunately we would be 50 years too late to this idea)

On the model 35 TTY, when you want to go to the next line, you send a carriage return (\r) followed by a newline (\n). \r moves the cursor back to the left, and \n moves the cursor down one row. If you only send \r, you’re able to type over the same line again, typing over what already was written.

I wrote a Python script that converts an image into a string of characters to send out to the teletype to do this. The algorithm is as follows:

  1. Render each printable Model 35 character into a bitmap of ink coverage.
  2. Divide the target image into a grid of cells, one per character position.
  3. For each cell, greedily pick the character that most reduces perceptual error. Repeat up to some max strikes per cell. If ink overlaps, then set pixel darkness according to Beer-Lambert (0.5 -> 0.75 -> 0.875). Edges detected in the image are weighted higher in error calculation.
  4. Spread residual error to neighboring cells via Floyd-Steinberg diffusion.

Take a close look at the image. You can see how several chars typed over each other contribute more darkness + texture:

A close-up of the overstrike portrait showing individual character cells.

Museum Visit #3: Minecraft, webserver, and a selfie

On our final trip to the museum, the UNIVAC came online right away with no hardware issues. I immediately had a good feeling about how the day was going to go.

We started the day by running a couple experiments that we brought with us:

  • We tested all cases of add/sub with -0 and +0. This is when we confirmed that the UNIVAC deviates from the typical ones’ complement scheme by normalizing -0 to +0 in the non-carry path.
  • We ran a memory check to confirm that we have exactly 40,960 words.

Then we ran some other programs we brought: TheScienceElf’s neat pi and Euler programs, my SHA-256 program, and Steven’s Battleship program all worked.

Teletype paper showing the SHA-256 utility hashing three inputs.

The SHA-256 utility hashing three inputs (HELLO WORLD, YAY, UNIVAC).

But now the moment of truth, will our concurrent IO changes work? Can we get Minecraft running?

As usual, we have to start simple and build up our primitives. I came prepared with a simple test program that printed the ringbuffer stats as it ran to confirm that my understanding of the manual was correct. And sure enough, it worked exactly like I expected over serial. The write pointer was circling through the buffer.

Next up for testing was our webserver program, since that was still simpler than Minecraft. I could feel myself getting nervous. We loaded it up and connected PPP… and no good! We couldn’t connect. My heart sank. It was lunch time, so we left to eat and brainstorm. But before we left, we kicked off the overstrike ASCII art program, which we expected to take 10s of minutes to print. The result looked great!

A strip of teletype paper held up above the Model 35, showing an ASCII portrait of Nathan.

When we came back, we reloaded the webserver to just try again… and it just worked! Maybe we misconfigured it on the first attempt? I could curl no problem. I loaded on my browser and…

Nathan giving a thumbs up next to the UNIVAC while holding a laptop with a webpage open.

Unreal! This demonstrates PPP/IP/TCP all working over serial on the UNIVAC to serve a webpage that I fetched with my modern computer! I couldn’t believe it. (I don’t know why that extra “H” appears. I bet it has something to do with the additional request Chrome makes for “favicon.ico”. No idea :) )

Now for the moment of truth. What about Minecraft?

We loaded the program. I started up my Minecraft client. I pointed it to the UNIVAC IP and clicked connect. Sure enough, on the first try, we logged in!

I was over the moon. All these months of debugging + clever hacks and finally we did what was thought impossible (at least, TheScienceElf thought it was impossible :)).

We spent the rest of the afternoon running programs to get footage for the video and generally celebrating our accomplishments of the last 8 months.


Conclusion

What a wild ride. My favorite projects are the ones that I didn’t know were possible when I set off to go do them.

I enjoy the thought that everything we did here was technically possible 60 years ago. Can you imagine going back in time and dropping them a paper tape with these programs on it? They’d lose their minds!

Thanks so much to the people that made this possible: Duane, Bill, Steven, and TheScienceElf. Thanks to all the staff at VCF for allowing us to come out and have a great time with the computer! What an amazing experience.

Thanks for reading! Source is here.

Wile E. Coyote operating a UNIVAC in a Looney Tunes cartoon.

Nathan pushes the buttons to start the Minecraft server on the UNIVAC, 2026 (colorized)

↑ top

23.Fields Medal Video: Maryna Viazovska (2022)

Sourcehttps://www.simonsfoundation.org/2022/07/05/fields-medal-video-maryna-viazovska/

SiteSimons Foundation

Submitterganitam (Hacker News)

Published2022-07-05

HN activity21 points · 7 comments

Length116 words (~1 min read)

Languageen-US

Fields Medal Video: Maryna Viazovska on Simons Foundation

Maryna Viazovska of the École Polytechnique Fédérale de Lausanne (EPFL) proved that the E8 lattice provides the densest packing of identical spheres in eight dimensions while also solving certain problems in Fourier analysis.

This video was presented during the opening ceremony of the International Congress of Mathematicians in Helsinki on July 5, 2022, organized by the International Mathematical Union.

Read about Viazovska’s work in detail:

In Times of Scarcity, War and Peace, a Ukrainian Finds the Magic in Math, Quanta Magazine

Sphere-Packing Solved in Higher Dimensions, Quanta Magazine

Out of a Magic Math Function, One Solution to Rule Them All, Quanta Magazine

The 2022 Fields Medal winners are:

↑ top

24.Zindex – Diagram Infrastructure for Agents

Sourcehttps://zindex.ai/

SiteZindex

Submitter_ben_ (Hacker News)

Submitted2026-04-21 20:27 UTC (Hacker News)

HN activity39 points · 15 comments

Length323 words (~2 min read)

Languageen

Diagram infrastructure for agents. Create, validate, and render diagrams through the Diagram Scene Protocol.

Agents create, edit, validate, and render diagrams as durable state - not throwaway output. Structured operations, immutable revisions, 40+ validation rules, and multiple render targets through the Diagram Scene Protocol (DSP).

zindex architecture

agent DSP zindex validate normalize scene layout render SVG PNG
{
  "schemaVersion": "0.1",
  "scene": {
    "id": "payments-arch",
    "units": "px"
  },
  "elements": [
    {
      "id": "api",
      "kind": "node",
      "nodeType": "service",
      "shape": "roundedRect",
      "label": "API Gateway"
    },
    {
      "id": "queue",
      "kind": "node",
      "nodeType": "queue",
      "label": "Job Queue"
    },
    {
      "id": "e1",
      "kind": "edge",
      "from": { "elementId": "api" },
      "to": { "elementId": "queue" },
      "router": "orthogonal"
    }
  ]
}

Semantic, not geometric

Agents declare nodes, edges, and relationships. Layout is computed, not hand-placed.

Layout engine built in

A Sugiyama-style hierarchical layout pipeline figures out positions, edge routes, and label placement automatically. Agents describe the graph; the engine handles the geometry.

Patchable

Stable IDs enable incremental updates. Add a node, move an edge - without regenerating the entire diagram.

Renderer-agnostic

One canonical scene, multiple outputs: SVG and PNG with 4 render themes (clean, dark, blueprint, sketch).

Deterministic

Same input, same output. Validate → normalize → layout → render. Every step is inspectable.

01

Incremental editing

Patch-based updates instead of full regeneration. Agents can modify individual elements while preserving the rest.

02

Deterministic execution

Consistent output across runs. Failures are explainable. The pipeline is inspectable at every step.

03

Durable state

Revision history, diffs, stable IDs. Diagrams are versioned artifacts, not ephemeral outputs.

04

Multi-agent ready

Shared infrastructure for multiple agents collaborating on diagrams. Not just a single-shot generator.

05

Domain-aware

Purpose-built for architecture, BPMN workflows, ER diagrams, sequence diagrams, org charts, and network topology - not generic vector shapes.

06

Production-grade

17 operation types. 40+ semantic validation rules. Auth, rate limiting, PostgreSQL storage.

agents / LLMs decide what should change

zindex apply changes through DSP protocol

renderers display the result

Zindex is to diagrams what a database is to application state.

The agent-native runtime for creating, updating, validating, and rendering diagrams as durable state.

↑ top

25.Show HN: GoModel – an open-source AI gateway in Go

Sourcehttps://github.com/ENTERPILOT/GOModel/

SiteGitHub

Submittersantiago-pl (Hacker News)

Submitted2026-04-21 14:11 UTC (Hacker News)

HN activity166 points · 61 comments

Length1.1K words (~5 min read)

Languageen

High-performance AI gateway written in Go - unified OpenAI-compatible API for OpenAI, Anthropic, Gemini, Groq, xAI & Ollama. LiteLLM alternative with observability, guardrails & streaming. ...

CI Docs Discord Docker Pulls Go Version

A high-performance AI gateway written in Go, providing a unified OpenAI-compatible API for OpenAI, Anthropic, Gemini, xAI, Groq, OpenRouter, Z.ai, Azure OpenAI, Oracle, Ollama, and more.

Animated GoModel AI gateway dashboard showing usage analytics, token tracking, and estimated cost monitoring

Quick Start - Deploy the AI Gateway

Step 1: Start GoModel

docker run --rm -p 8080:8080 \
  -e LOGGING_ENABLED=true \
  -e LOGGING_LOG_BODIES=true \
  -e LOG_FORMAT=text \
  -e LOGGING_LOG_HEADERS=true \
  -e OPENAI_API_KEY="your-openai-key" \
  enterpilot/gomodel

Pass only the provider credentials or base URL you need (at least one required):

docker run --rm -p 8080:8080 \
  -e OPENAI_API_KEY="your-openai-key" \
  -e ANTHROPIC_API_KEY="your-anthropic-key" \
  -e GEMINI_API_KEY="your-gemini-key" \
  -e GROQ_API_KEY="your-groq-key" \
  -e OPENROUTER_API_KEY="your-openrouter-key" \
  -e ZAI_API_KEY="your-zai-key" \
  -e XAI_API_KEY="your-xai-key" \
  -e AZURE_API_KEY="your-azure-key" \
  -e AZURE_BASE_URL="https://your-resource.openai.azure.com/openai/deployments/your-deployment" \
  -e AZURE_API_VERSION="2024-10-21" \
  -e ORACLE_API_KEY="your-oracle-key" \
  -e ORACLE_BASE_URL="https://inference.generativeai.us-chicago-1.oci.oraclecloud.com/20231130/actions/v1" \
  -e ORACLE_MODELS="openai.gpt-oss-120b,xai.grok-3" \
  -e OLLAMA_BASE_URL="http://host.docker.internal:11434/v1" \
  enterpilot/gomodel

⚠️ Avoid passing secrets via -e on the command line - they can leak via shell history and process lists. For production, use docker run --env-file .env to load API keys from a file instead.

Step 2: Make your first API call

curl http://localhost:8080/v1/chat/completions \
  -H "Content-Type: application/json" \
  -d '{
    "model": "gpt-5-chat-latest",
    "messages": [{"role": "user", "content": "Hello!"}]
  }'

That's it! GoModel automatically detects which providers are available based on the credentials you supply.

Supported LLM Providers

Example model identifiers are illustrative and subject to change; consult provider catalogs for current models. Feature columns reflect gateway API support, not every individual model capability exposed by an upstream provider.

Provider Credential Example Model Chat /responses Embed Files Batches Passthru
OpenAI OPENAI_API_KEY gpt-4o-mini
Anthropic ANTHROPIC_API_KEY claude-sonnet-4-20250514
Google Gemini GEMINI_API_KEY gemini-2.5-flash
Groq GROQ_API_KEY llama-3.3-70b-versatile
OpenRouter OPENROUTER_API_KEY google/gemini-2.5-flash
Z.ai ZAI_API_KEY (ZAI_BASE_URL optional) glm-5.1
xAI (Grok) XAI_API_KEY grok-2
Azure OpenAI AZURE_API_KEY + AZURE_BASE_URL (AZURE_API_VERSION optional) gpt-4o
Oracle ORACLE_API_KEY + ORACLE_BASE_URL openai.gpt-oss-120b
Ollama OLLAMA_BASE_URL llama3.2

✅ Supported ❌ Unsupported

For Z.ai's GLM Coding Plan, set ZAI_BASE_URL=https://api.z.ai/api/coding/paas/v4. For Oracle, set ORACLE_MODELS=openai.gpt-oss-120b,xai.grok-3 when the upstream /models endpoint is unavailable.


Alternative Setup Methods

Running from Source

Prerequisites: Go 1.26.2+

  1. Create a .env file:

    cp .env.template .env
  2. Add your API keys to .env (at least one required).

  3. Start the server:

    make run

Docker Compose

Infrastructure only (Redis, PostgreSQL, MongoDB, Adminer - no image build):

docker compose up -d
# or: make infra

Full stack (adds GoModel + Prometheus; builds the app image):

cp .env.template .env
# Add your API keys to .env
docker compose --profile app up -d
# or: make image
Service URL
GoModel API http://localhost:8080
Adminer (DB UI) http://localhost:8081
Prometheus http://localhost:9090

Building the Docker Image Locally

docker build -t gomodel .
docker run --rm -p 8080:8080 --env-file .env gomodel

OpenAI-Compatible API Endpoints

Endpoint Method Description
/v1/chat/completions POST Chat completions (streaming supported)
/v1/responses POST OpenAI Responses API
/v1/embeddings POST Text embeddings
/v1/files POST Upload a file (OpenAI-compatible multipart)
/v1/files GET List files
/v1/files/{id} GET Retrieve file metadata
/v1/files/{id} DELETE Delete a file
/v1/files/{id}/content GET Retrieve raw file content
/v1/batches POST Create a native provider batch (OpenAI-compatible schema; inline requests supported where provider-native)
/v1/batches GET List stored batches
/v1/batches/{id} GET Retrieve one stored batch
/v1/batches/{id}/cancel POST Cancel a pending batch
/v1/batches/{id}/results GET Retrieve native batch results when available
/p/{provider}/... GET, POST, PUT, PATCH, DELETE, HEAD, OPTIONS Provider-native passthrough with opaque upstream responses
/v1/models GET List available models
/health GET Health check
/metrics GET Prometheus metrics (when enabled)
/admin/api/v1/usage/summary GET Aggregate token usage statistics
/admin/api/v1/usage/daily GET Per-period token usage breakdown
/admin/api/v1/usage/models GET Usage breakdown by model
/admin/api/v1/usage/log GET Paginated usage log entries
/admin/api/v1/audit/log GET Paginated audit log entries
/admin/api/v1/audit/conversation GET Conversation thread around one audit log entry
/admin/api/v1/models GET List models with provider type
/admin/api/v1/models/categories GET List model categories
/admin/dashboard GET Admin dashboard UI
/swagger/index.html GET Swagger UI (when enabled)

Gateway Configuration

GoModel is configured through environment variables and an optional config.yaml. Environment variables override YAML values. See .env.template and config/config.example.yaml for the available options.

Key settings:

Variable Default Description
PORT 8080 Server port
GOMODEL_MASTER_KEY (none) API key for authentication
ENABLE_PASSTHROUGH_ROUTES true Enable provider-native passthrough routes under /p/{provider}/...
ALLOW_PASSTHROUGH_V1_ALIAS true Allow /p/{provider}/v1/... aliases while keeping /p/{provider}/... canonical
ENABLED_PASSTHROUGH_PROVIDERS openai,anthropic,openrouter,zai Comma-separated list of enabled passthrough providers
STORAGE_TYPE sqlite Storage backend (sqlite, postgresql, mongodb)
METRICS_ENABLED false Enable Prometheus metrics
LOGGING_ENABLED false Enable audit logging
GUARDRAILS_ENABLED false Enable the configured guardrails pipeline

Quick Start - Authentication: By default GOMODEL_MASTER_KEY is unset. Without this key, API endpoints are unprotected and anyone can call them. This is insecure for production. Strongly recommend setting a strong secret before exposing the service. Add GOMODEL_MASTER_KEY to your .env or environment for production deployments.


Response Caching

GoModel has a two-layer response cache that reduces LLM API costs and latency for repeated or semantically similar requests.

Layer 1 - Exact-match cache

Hashes the full request body (path + Workflow + body) and returns a stored response on byte-identical requests. Sub-millisecond lookup. Activate by environment variables: RESPONSE_CACHE_SIMPLE_ENABLED and REDIS_URL.

Responses served from this layer carry X-Cache: HIT (exact).

Layer 2 - Semantic cache

Embeds the last user message via your configured provider’s OpenAI-compatible /v1/embeddings API (cache.response.semantic.embedder.provider must name a key in the top-level providers map) and performs a KNN vector search. Semantically equivalent queries - e.g. "What's the capital of France?" vs "Which city is France's capital?" - can return the same cached response without an upstream LLM call.

Expected hit rates: ~60–70% in high-repetition workloads vs. ~18% for exact-match alone.

Responses served from this layer carry X-Cache: HIT (semantic).

Supported vector backends: qdrant, pgvector, pinecone, weaviate (set cache.response.semantic.vector_store.type and the matching nested block).

Both cache layers run after guardrail/workflow patching so they always see the final prompt. Use Cache-Control: no-cache or Cache-Control: no-store to bypass caching per-request.


See DEVELOPMENT.md for testing, linting, and pre-commit setup.


Roadmap to 0.2.0

Must Have

  • Intelligent routing
  • Broader provider support: Oracle model configuration via environment variables, plus Cohere, Command A, Operational, and DeepSeek V3
  • Budget management with limits per user_path and/or API key
  • Editable model pricing for accurate cost tracking and budgeting
  • Full support for the OpenAI /responses and /conversations lifecycle
  • Prompt cache visibility showing how much of each prompt was cached by the provider
  • Guardrails hardening: better UI, simpler architecture, easier custom guardrails, and response-side guardrails before output reaches the client
  • Passthrough for all providers, beyond the current OpenAI and Anthropic beta
  • Fix failover charts in the dashboard

Should Have

  • Cluster mode

Community

Join our Discord to connect with other GoModel users.

Star History

Star History Chart

↑ top

26.Trellis AI (YC W24) Is hiring engineers to build self-improving agents

Sourcehttps://www.ycombinator.com/companies/trellis-ai/jobs/SvzJaTH-member-of-technical-staff-product-engineering-full-time

SiteY Combinator

Submittermacklinkachorn (Hacker News)

Submitted2026-04-21 17:01 UTC (Hacker News)

HN activity1 points · 0 comments

Length636 words (~3 min read)

Languageen

Trellis builds and deploys computer use agents to get patients access to life-saving medicine. Our computer-use AI agents process billions of dollars worth of therapies annually with patients in all fifty states. We do this by automating document intake, prior authorizations, and appeals at scale to streamline operations and accelerate care. We classify medical referrals, understand chart notes, and automate contract and reimbursement search to provide patients with accurate coverage determinations and cost responsibility. Think of us as the Stripe of healthcare billing and reimbursements. Trellis is a spinout from Stanford AI Lab and is backed by leading investors including YC, General Catalyst, Telesoft Partners, and executives at Google and Salesforce. 🧍🏻‍♂️Why work with us - Real impact at massive scale: We serve patients in all fifty states and are scaling to hundreds of healthcare locations. You'll directly see the number of patients who received treatment because of the agents you built. - Work with industry experts: Apply your AI alongside healthcare operations leaders who have overseen 50+ healthcare locations, gaining deep domain expertise while building cutting-edge technology. - Be at the forefront of AI in healthcare: Build production-grade agentic systems that make critical healthcare decisions, backed by robust evaluation frameworks. - Direct customer engagement: Work closely with F500 customers and the founding team. You'll wear multiple hats from technical architecture to customer success. - Extreme ownership: Own key parts of Trellis's technical infrastructure and have opportunities to launch new initiatives that process billions in healthcare transactions. - World-class team: Join team members who have won international physics olympiads, published economics research, were founding engineers at unicorn startups, and taught AI classes to hundreds of Stanford graduate students. - Incredible growth and traction: We've grown revenue 10x in the past few months alone and have XX% market share in the specialty healthcare markets we serve. What you'll build - Agentic frameworks for healthcare decision-making: Design and implement AI systems that autonomously navigate complex reimbursement logic and prior authorization workflows. - 24/7 AI co-workers: Build and deploy long-running agent workers that triage and process healthcare data around the clock, functioning as reliable digital teammates for care teams. - Production-grade AI systems: Develop your agents within our comprehensive evaluation suite, ensuring production-ready performance from day one. Requirements - Experience architecting, developing, and testing full-stack code end-to-end - Expertise in programming languages such as Python, Go and ML/NLP libraries such as PyTorch, TensorFlow, Transformers - Being proactive and a fast-learner with bias for action - Experience working with relational and non-relational databases, especially Postgres - Experience with data and ML infrastructure - Open source contributions and projects are a big plus - Experience with cloud platforms (e.g., AWS, Azure, GCP) and containerization technologies (e.g., Docker, Kubernetes) is a plus

AI for streamlining healthcare paperwork

Member of Technical Staff, Product Engineering (full-time)

$100K - $225K0.10% - 1.50%San Francisco, CA, US

Job type

Full-time

Role

Engineering, Full stack

Experience

Any (new grads ok)

Visa

US citizen/visa only

Apply to Trellis AI and hundreds of other fast-growing YC startups with a single profile.

Apply to role ›

About the role

Trellis builds and deploys computer use agents to get patients access to life-saving medicine.

Our computer-use AI agents process billions of dollars worth of therapies annually with patients in all fifty states. We do this by automating document intake, prior authorizations, and appeals at scale to streamline operations and accelerate care. We classify medical referrals, understand chart notes, and automate contract and reimbursement search to provide patients with accurate coverage determinations and cost responsibility. Think of us as the Stripe of healthcare billing and reimbursements.

Trellis is a spinout from Stanford AI Lab and is backed by leading investors including YC, General Catalyst, Telesoft Partners, and executives at Google and Salesforce.

🧍🏻‍♂️Why work with us

  • Real impact at massive scale: We serve patients in all fifty states and are scaling to hundreds of healthcare locations. You'll directly see the number of patients who received treatment because of the agents you built.
  • Work with industry experts: Apply your AI alongside healthcare operations leaders who have overseen 50+ healthcare locations, gaining deep domain expertise while building cutting-edge technology.
  • Be at the forefront of AI in healthcare: Build production-grade agentic systems that make critical healthcare decisions, backed by robust evaluation frameworks.
  • Direct customer engagement: Work closely with F500 customers and the founding team. You'll wear multiple hats from technical architecture to customer success.
  • Extreme ownership: Own key parts of Trellis's technical infrastructure and have opportunities to launch new initiatives that process billions in healthcare transactions.
  • World-class team: Join team members who have won international physics olympiads, published economics research, were founding engineers at unicorn startups, and taught AI classes to hundreds of Stanford graduate students.
  • Incredible growth and traction: We've grown revenue 10x in the past few months alone and have XX% market share in the specialty healthcare markets we serve.

What you'll build

  • Agentic frameworks for healthcare decision-making: Design and implement AI systems that autonomously navigate complex reimbursement logic and prior authorization workflows.
  • 24/7 AI co-workers: Build and deploy long-running agent workers that triage and process healthcare data around the clock, functioning as reliable digital teammates for care teams.
  • Production-grade AI systems: Develop your agents within our comprehensive evaluation suite, ensuring production-ready performance from day one.

Requirements

  • Experience architecting, developing, and testing full-stack code end-to-end
  • Expertise in programming languages such as Python, Go and ML/NLP libraries such as PyTorch, TensorFlow, Transformers
  • Being proactive and a fast-learner with bias for action
  • Experience working with relational and non-relational databases, especially Postgres
  • Experience with data and ML infrastructure
  • Open source contributions and projects are a big plus
  • Experience with cloud platforms (e.g., AWS, Azure, GCP) and containerization technologies (e.g., Docker, Kubernetes) is a plus

About Trellis AI

Trellis helps healthcare providers treat more patients, faster—while eliminating pre-service paperwork.

We automate document intake, prior authorizations, and appeals at scale to streamline operations and accelerate care.

Our AI agent is trained on millions of clinical data points and converts messy, unstructured documents into clean, structured data directly in your EHR.

With Trellis, leading healthcare providers and pharmaceutical companies were able to:

  1. Reduce time to treatment by over 90%

  2. Improve prior authorization approval and reimbursement rates

  3. Leverage structured data to enhance drug program performance and clinical decision-making

Administrative costs account for over 20% of U.S. healthcare spending—delaying care, draining revenue, and driving staff burnout while having less visibility into patient care than ever before. We built Trellis to tackle this head on.

Founded:2024

Batch:W24

Team Size:25

Status:Active

X (Twitter) logo

Founders

Mac Klinkachorn

Twitter account

Founder

Jacky Lin

Founder

Similar Jobs

Boundary

BoldVoice

Tennr

SubImage

Ridecell

Brickanta

Speak

Versable

F2

Sphere

TaxGPT

cubic

IronLedger.ai

Firecrawl

Entangl

AveryIQ

JustAI

StackAI

Scispot

Rovi Health

↑ top

27.Show HN: VidStudio, a browser based video editor that doesn't upload your files

Sourcehttps://vidstudio.app/video-editor

Sitevidstudio.app

Submitterkolx (Hacker News)

Submitted2026-04-21 11:58 UTC (Hacker News)

HN activity252 points · 80 comments

Length178 words (~1 min read)

Languageen

Free online video resizer and editor. Resize, compress, trim, and convert videos privately in your browser. No upload, no install — works on any device.

↑ top

28.My practitioner view of program analysis

Sourcehttps://sawyer.dev/posts/practitioner-program-analysis/

Sitesawyer.dev

Submitterevakhoury (Hacker News)

Submitted2026-04-20 15:27 UTC (Hacker News)

HN activity39 points · 4 comments

Length687 words (~3 min read)

About ten years ago, I started thinking in earnest about how we could make it easier to write correct programs. Researching this question led me to topics like formal methods and type systems, techniques to help establish that a given program adheres to some rules. However, I was still unsure of how to prove that software was actually correct. Not in the sense that the executed instructions produce a result consistent with the specification, but in the sense that this program actually does what the people involved want it to do.

My practitioner view of program analysis

About ten years ago, I started thinking in earnest about how we could make it easier to write correct programs. Researching this question led me to topics like formal methods and type systems, techniques to help establish that a given program adheres to some rules. However, I was still unsure of how to prove that software was actually correct. Not in the sense that the executed instructions produce a result consistent with the specification, but in the sense that this program actually does what the people involved want it to do.

Unfortunately, this leads to an easy description of a seemingly impossible task: software is correct when everyone involved knows what the program should do and can confirm that the program only does what it should. In one sense, this is impossible. There's the program itself, but then there's the Program. The capital-P Program is the concept that lives in our heads. Agreeing that a program is correct is, in one sense, agreeing that we're all thinking the same thought (I guess I'm assuming this isn't possible; the philosphical feasibility of this is out of scope of this post). This leads to a more pedantic version of my previous statement: a program is correct when everyone involved agrees that the real-world program in effect is an adequate representation of the Program in their heads and the real-world program is doing only what it should. So, how do we know that the program as it exists is the Program we imagined?

The concept that I think has helped me the most when thinking about this problem is the semantic gap. The semantic gap, to me, highlights what we lose in the tradeoff of formalizing ideas into code. Some people can read the code, see that it reflects the Program in their heads, and say "lgtm". I think that's the ideal pattern of using code to decrease the semantic gap between people and our programs. But some people will read the same code and realize they have no idea how it connects to the Program in their heads. Having exhausted our tooling for reducing the semantic gap, and under pressure to keep things moving, what are we to do but solemnly type "lgtm"? It's clear that reading code cannot be the only method of communicating the intent of the ideas behind it. At the same time, though, I think the executable code has a compelling case to be the source of truth. But if code is an ineffective means of communication even among programmers, how do we help people understand programs? This, I think, is where program analysis comes in.

The way I think about program analysis is that it's a way for me to look at a program I wrote, ask "what have I done", and get a meaningful result. There are plenty of ways to do this, and while "running the code" is the most popular the branch of analysis I'm interested in is called static analysis. It's interesting to me because, ideally, we could take a set of specified components and ask questions about what the whole system is capable of but without using the resources involved in running the code. Does this program ever try to access specific data? Is there a way to get to this web page without logging in? To put it another way, there are decisions that need to be made within each program and we'd like confirmation that those decisions are being made carefully.

But decisions aren't always made in isolation and aren't always made by people who can read the code to verify it does the right thing. Being able to inspect systems — providing consistent and accurate answers to the questions people have about the programs that play a role in our everyday lives — is a necessity to ever have correct software. Even as the author of a program, we are only one blind person touching one part of the elephant. We need the perspective and understanding of others to confirm we've done the right thing.

↑ top

29.Southern Poverty Law Center indicted for fraud, money laundering

Sourcehttps://www.politico.com/news/2026/04/21/southern-poverty-law-center-justice-department-investigation-00885376

Sitepolitico.com

Submitterf38zf5vdt (Hacker News)

Submitted2026-04-22 02:39 UTC (Hacker News)

HN activity13 points · 4 comments

[scrape failed: http 403]

↑ top

30.In the UK, EVs are cheaper than petrol cars, thanks to Chinese competition

Sourcehttps://electrek.co/2026/04/18/in-the-uk-evs-are-cheaper-than-petrol-cars-thanks-to-chinese-competition/

SiteElectrek

AuthorJameson Dow

Published2026-04-18

HN activity154 points · 137 comments

Length1.1K words (~5 min read)

Languageen-US

EVs have long been cheaper to own, but now they're cheaper upfront, largely due to downward price pressure from affordable Chinese models.
Electric Cab London

It’s long been cheaper to own an electric car, due to lower fueling costs. But the upfront cost is now lower, according to UK’s largest auto-buying website Autotrader, and reported by The Guardian. And a large part of it is because of the availability of low-cost Chinese EVs, which are unavailable or subject to tariffs in many other countries.

Data from the UK’s largest auto-buying website Autotrader now says that the average EV costs £785 ($1,063) less than the average petrol-powered car, meaning that EVs result in both long-term savings from cheaper fuel and upfront savings from a lower purchase price (and, of course, the societal savings of less pollution).

The Guardian says the average new petrol car listed on Autotrader is £43,405, while the average electric car is £42,620, including discounts and taxes. Automakers have put high discounts on EVs lately in an attempt to meet decarbonization targets or face high penalties for polluting too much.

Another reason for the difference is an electric car grant implemented in the UK last year, giving buyers up to £3,750 off of an EV. The grant is limited by sticker price, which has influenced buyers to move towards lower-priced vehicles.

But one important point here is that plenty of lower-priced EVs are available in the UK, because the country does not ban the import of Chinese electric cars, nor does it even have a special tariff for EVs of Chinese origin, unlike both the US and the EU (though the EU might come to a deal with China soon).

The EU does allow Chinese-built EVs, but prices in Europe are higher due to tariffs. With no trade tariffs on Chinese EVs in the UK, they can cost upwards of ten thousand dollars/pounds less than they would across the channel.

And the presence of lower-cost alternatives can force non-Chinese brands to have to compete, rather than sitting on their laurels and gathering profits from expensive land yachts as the competition’s prices are inflated by tariffs. This is why the UK is getting Honda’s super cool Super-N, and the US isn’t. Or Volvo’s EX30, which was recently cancelled in the US, along with plenty of other models.

A quick search on Autotrader shows several brand new EVs available in the ~£15k (~$20k) range, from both Chinese and European brands.

The news of cheaper EVs bodes well for UK’s decarbonization targets, including a recently-weakened 2035 all-EV target. UK EV sales already surged at the end of last year, meeting the country’s end-of-2026 target a year early – that was due to an end-of-year spike, but it looks like the UK is roughly on target to meet its 2026 targets, if sales continue to rise through this year.

And while the news today is about upfront price, the question of running costs has become all the more important lately as global energy prices have spiked due to the incredible stupidity of the US war in Iran. This has led to increased interest in EVs in many parts of the world, including the UK, where petrol prices currently average around £1.6/liter, or £1.9/liter for diesel (~$8/gallon petrol or ~$10/gallon diesel).

Elsewhere in the world, Australia, another country that doesn’t put tariffs on Chinese EVs and has seen significant concern over energy cost spikes, has seen its own huge surge in EV sales lately, with focus on affordable Chinese models.

Electrek’s Take

I’ve long thought that the EV cost parity conversation was silly, and have asserted for a long time now that if you compare the full picture of the costs and benefits of a new EV, that EVs end up competitive or cheaper than vehicles of a similar level of quality.

Of course, part of the conversation is that I (and basically anyone who has driven an EV) consider EVs to be better than gas cars in so many ways, and I think that should be considered as part of the “quality” of the product in question.

Consumers accept that they can pay more for a better product, so when you compare a Model 3 to an ICE BMW 3 series, and they’re similar in price, but the Model 3 offers better technology and drive characteristics, then on balance you’re getting a better deal with the Model 3.

And then, of course, there’s the issue of running costs, which have long been lower with EVs, due to cheaper electricity and maintenance costs compared to complex, inefficient gas engines.

But now we don’t even have to have any of those conversations about running costs anymore, because the EV is just cheaper. At least in the UK.

The timing of this story is particularly interesting to me because this week we heard from multiple auto CEOs about the supposed existential threat to the auto industry from Chinese competition.

It led Ford CEO Jim Farley to state that Chinese EVs would destroy the “heart and soul” of the US if the US were forced to compete with a country that has taken EVs seriously. He said this after lobbying to roll back emissions targets in both the US and Europe and retreating on EV programs.

His proposed solution? Don’t (ever?) let Chinese autos into the US, the supposed bastion of free market competition, the country that claims unfettered capitalism will breed innovation and that those dirty communists in China can do nothing but steal and make low-quality goods.

Meanwhile, the average car price in the US has reached historic highs, and while EV prices are coming down a little, they’re still thousands of dollars more expensive on average upfront than gas (though still cheaper in lifetime costs, despite massive subsidies for gasoline).

The UK shows us that it doesn’t have to be that way – the simpler and better vehicle can be cheaper upfront, cheaper to fuel, and easier on the environment, a win-win-win.

But, if all of us have to pay thousands of dollars extra for our cars, and to fuel our cars, and for our health bills from the pollution they cause, and for the trillion-dollar military misadventures that do nothing positive except spike our energy costs, I guess that’s just the price we have to to pay to support an industry which has repeatedly lobbied against our interests, up to and including this very week.


Charge your electric vehicle at home using rooftop solar panels. Find a reliable and competitively priced solar installer near you on EnergySage, for free. They have pre-vetted installers competing for your business, ensuring high-quality solutions and 20-30% savings. It’s free, with no sales calls until you choose an installer. Compare personalized solar quotes online and receive guidance from unbiased Energy Advisers. Get started here. – ad*

Add Electrek as a preferred source on Google Add Electrek as a preferred source on Google

FTC: We use income earning auto affiliate links. More.

↑ top